The story so far...
In the first part of this series I described the problem I was having, my hypothesis as to the source of the issue, and the steps I would take to test my hypothesis. In the second post I described the electronics that I built to start capturing environmental sensor data. The third post describes the code for the IoT sensor rig to send telemetry data to Azure IoT Hub. The fourth post addressed the configuration within Azure IoT Hub. The fifth post got Power BI and Azure Stream Analytics configured to pass data from Azure IoT Hub to Power BI.
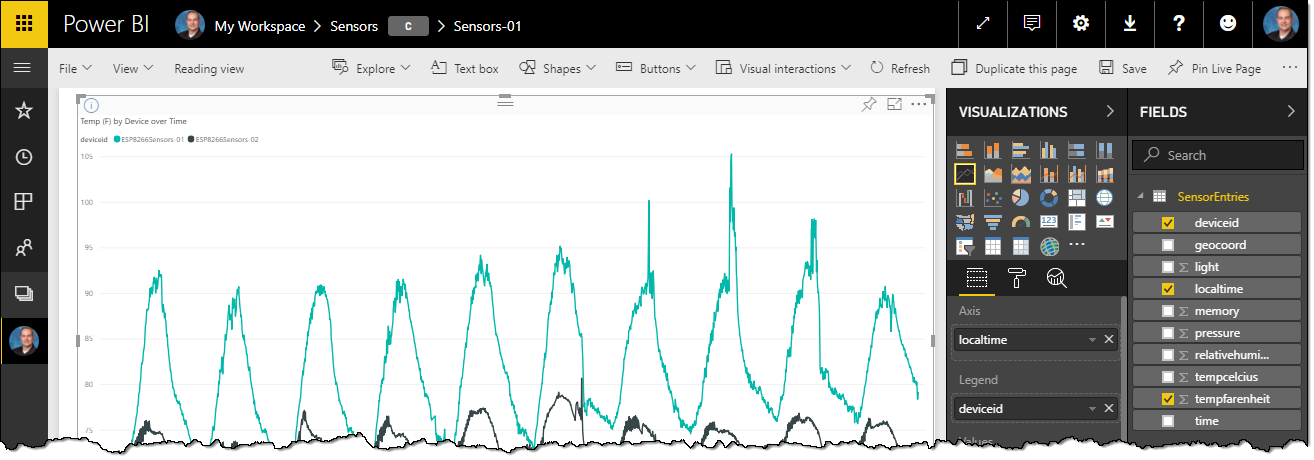
This post will show how to get the data charted in Power BI so that we can interpret it.
Blog Series Table of Contents
Part 1 - Problem Space
Part 2 - Electronics
Part 3 - ESP8266 Code
Part 4 - Azure IoT Hub
Part 5 - Azure Stream Analytics
Part 6 - Power BI <-- This post
Part 7 - Drawing Conclusions
Install Power BI Desktop
-
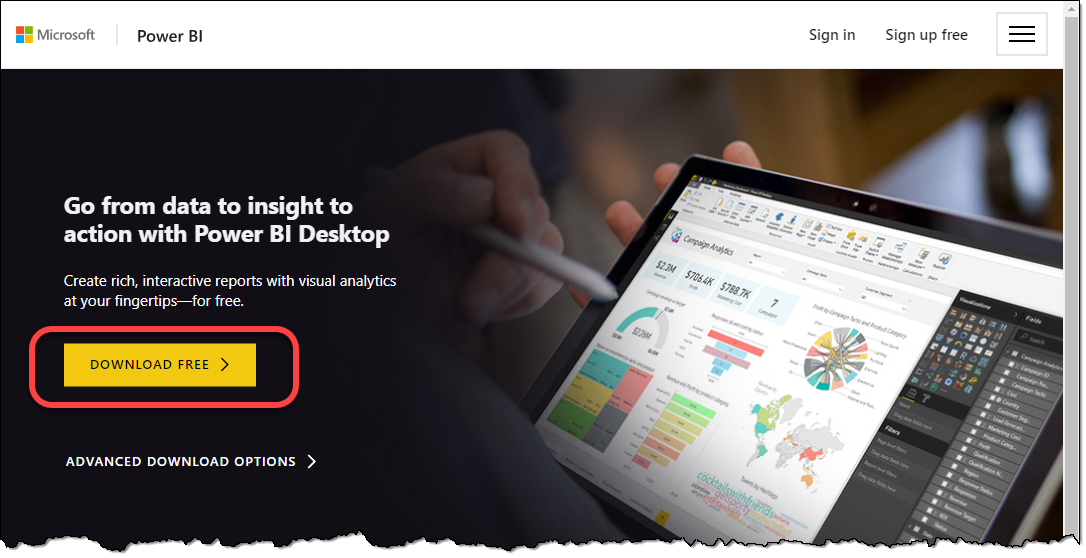
Open a browser and navigate to the Power BI homepage. You should see a DOWNLOAD FREE button. This will download Power BI Desktop.
-
When download completes, run the installer.
Connect to your data in Azure
-
Launch Power BI Desktop.
-
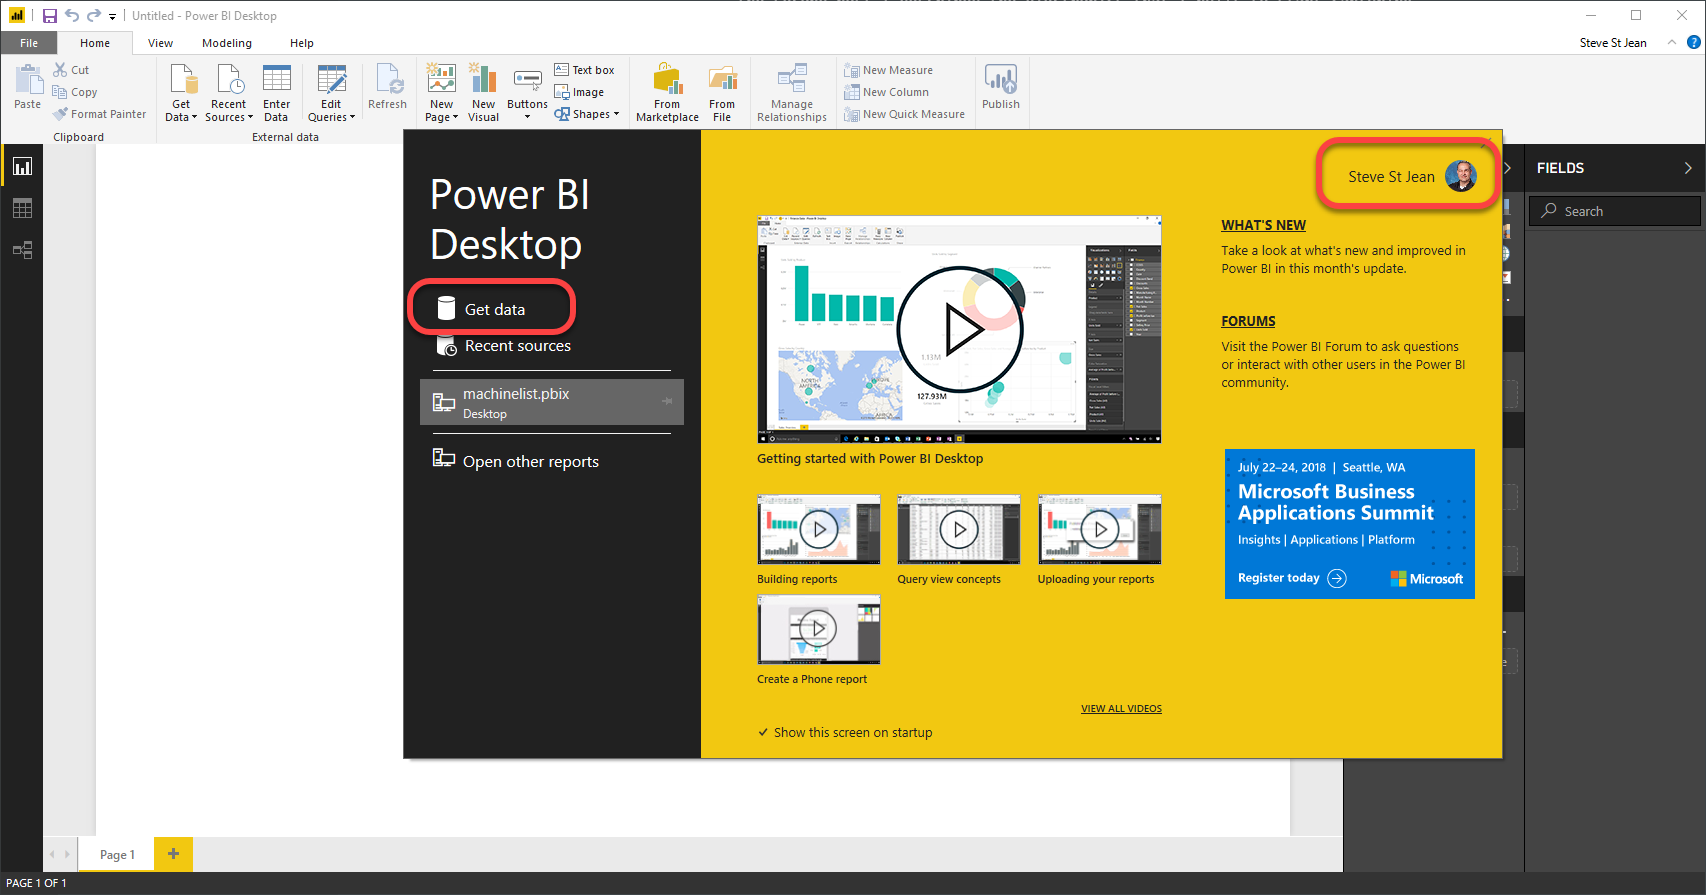
When Power BI Desktop starts it shows a start screen. In the screenshot below you can see my picture in the upper-right corner because I'm logged in. If you need to login, please do so. After logging in, click on the Get data link.
-
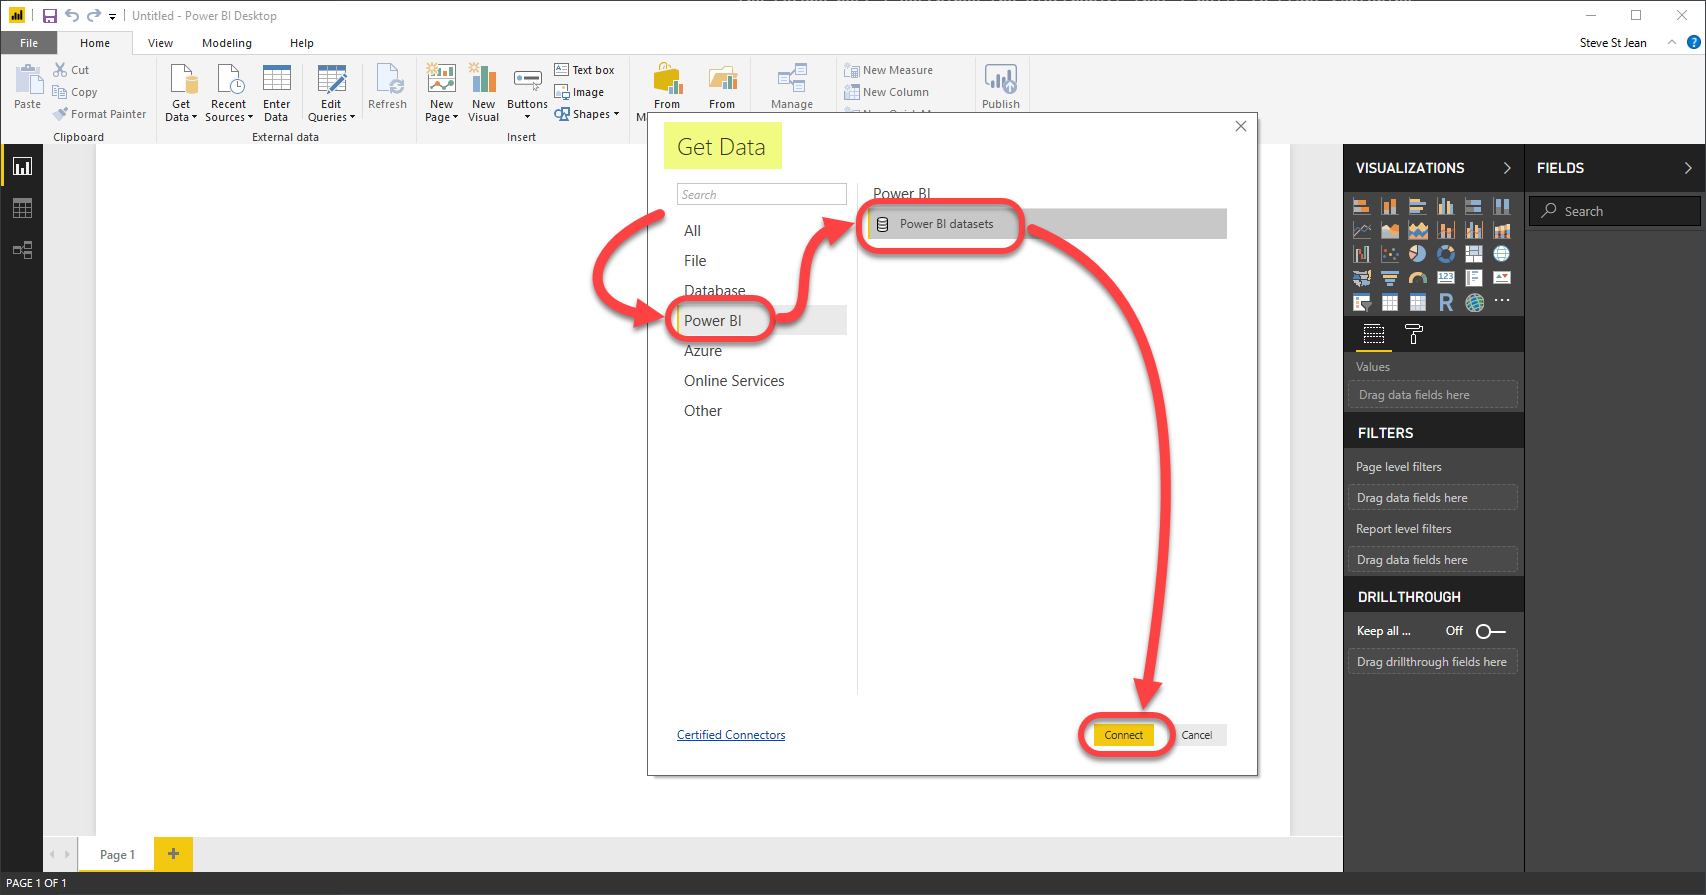
In the Get Data dialog select Power BI as the data connection type and then select Power BI dataset as the data connector. Click the Connect button to continue.
-
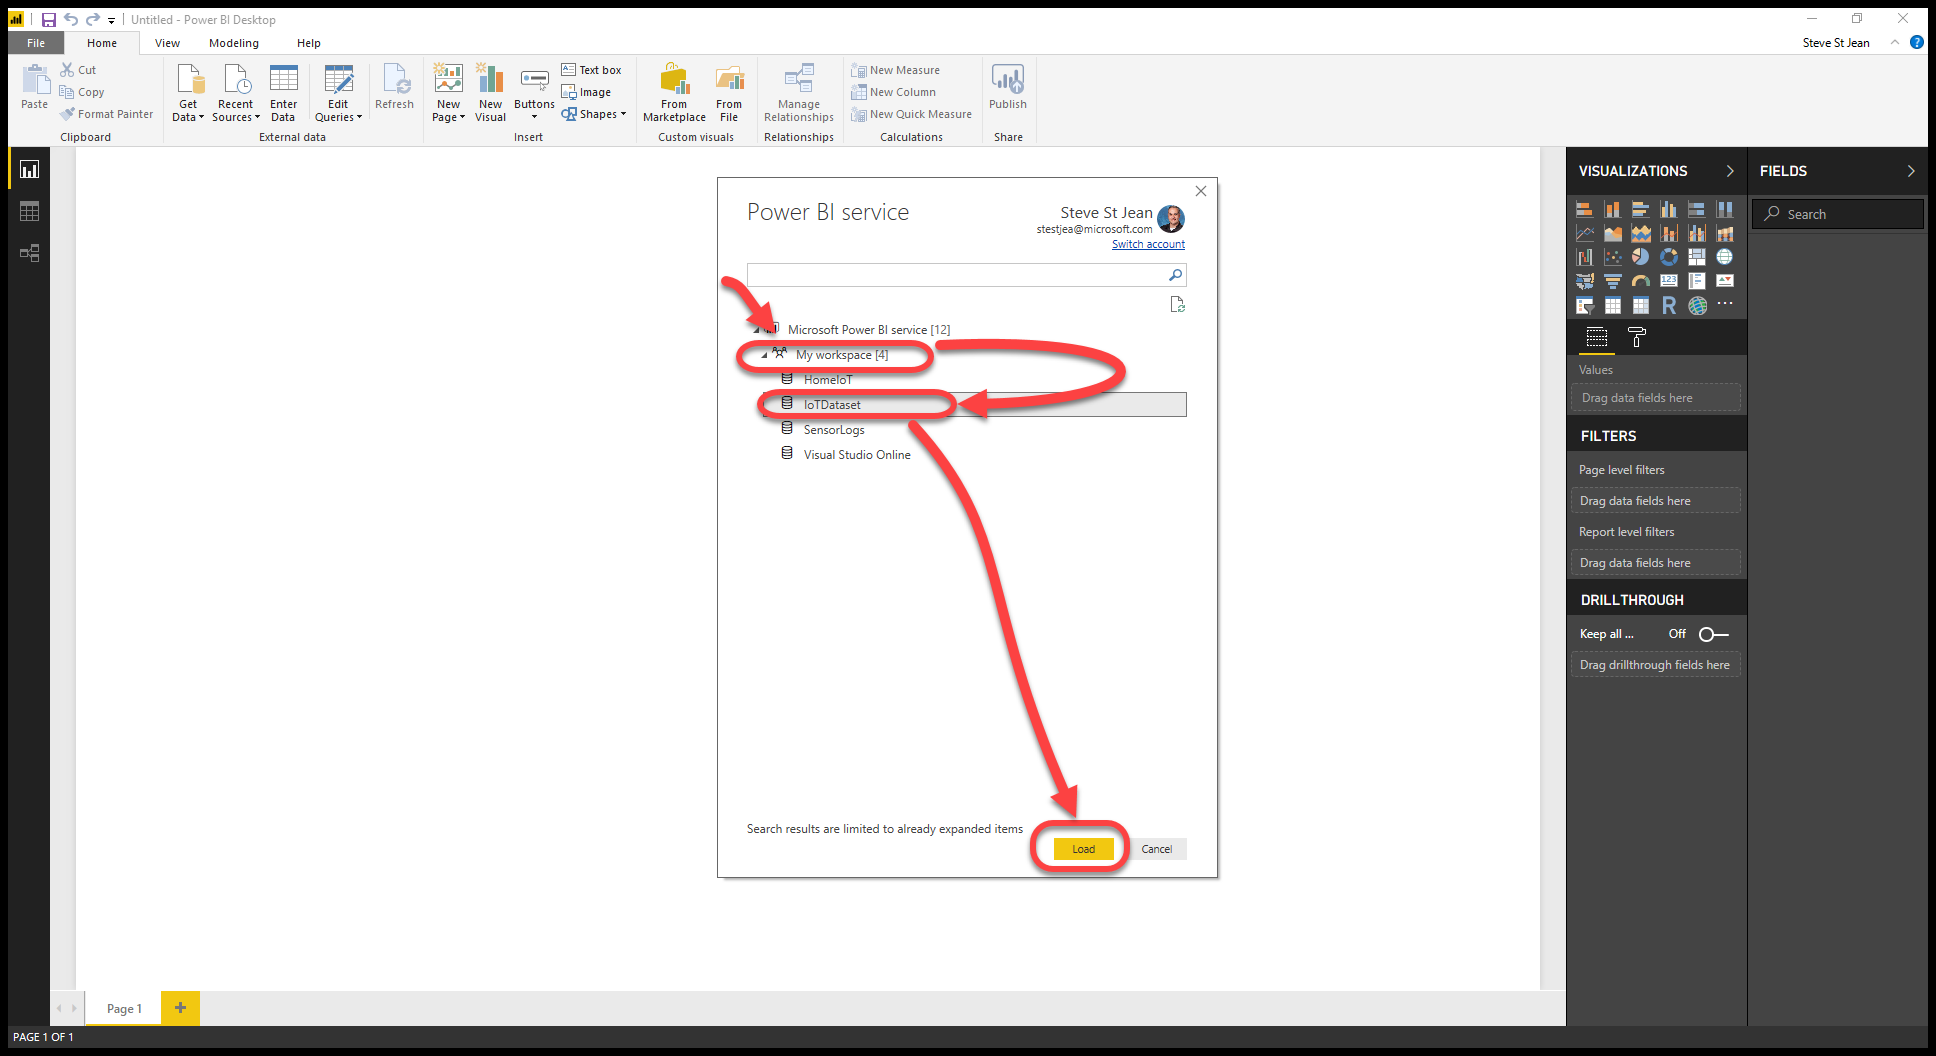
In the Power BI service dialog expand the My workspace node, find the dataset that was created by your Stream Analytics job, select it and then click the Load button.
Create chart in Power BI Desktop
-
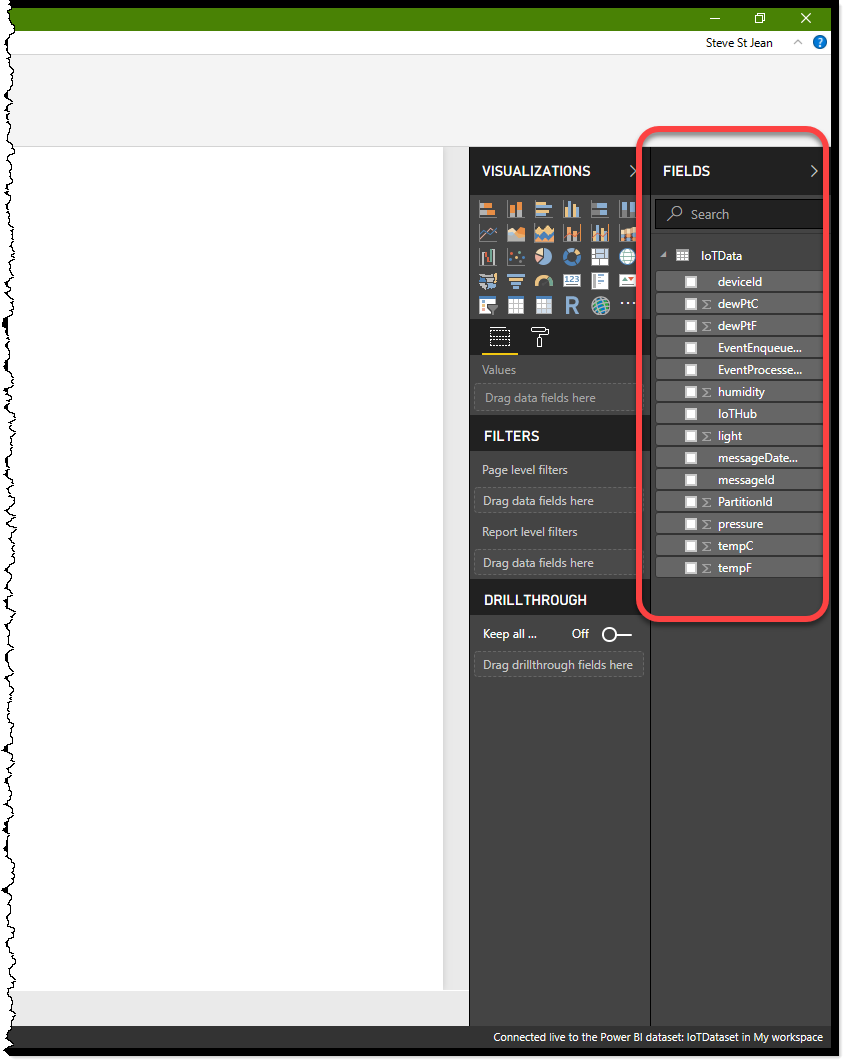
Welcome to the Power BI Desktop. On the right you should see the Fields list has been populate with the data fields published to Azure IoT Hub by your sensor rig. This is where we will start.
-
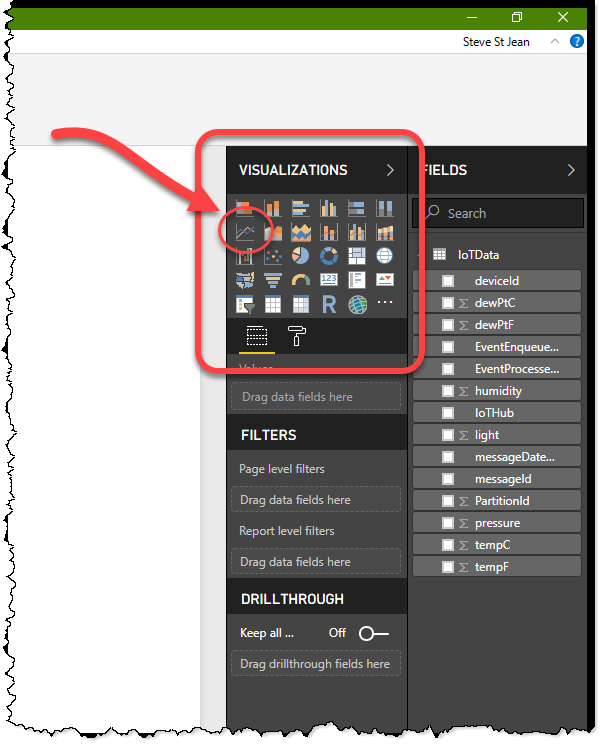
Now let's start graphing our data. We know that we want to see a graph, so let's setup Power BI to graph. In the Visualizations section, click on the Line chart icon.
-
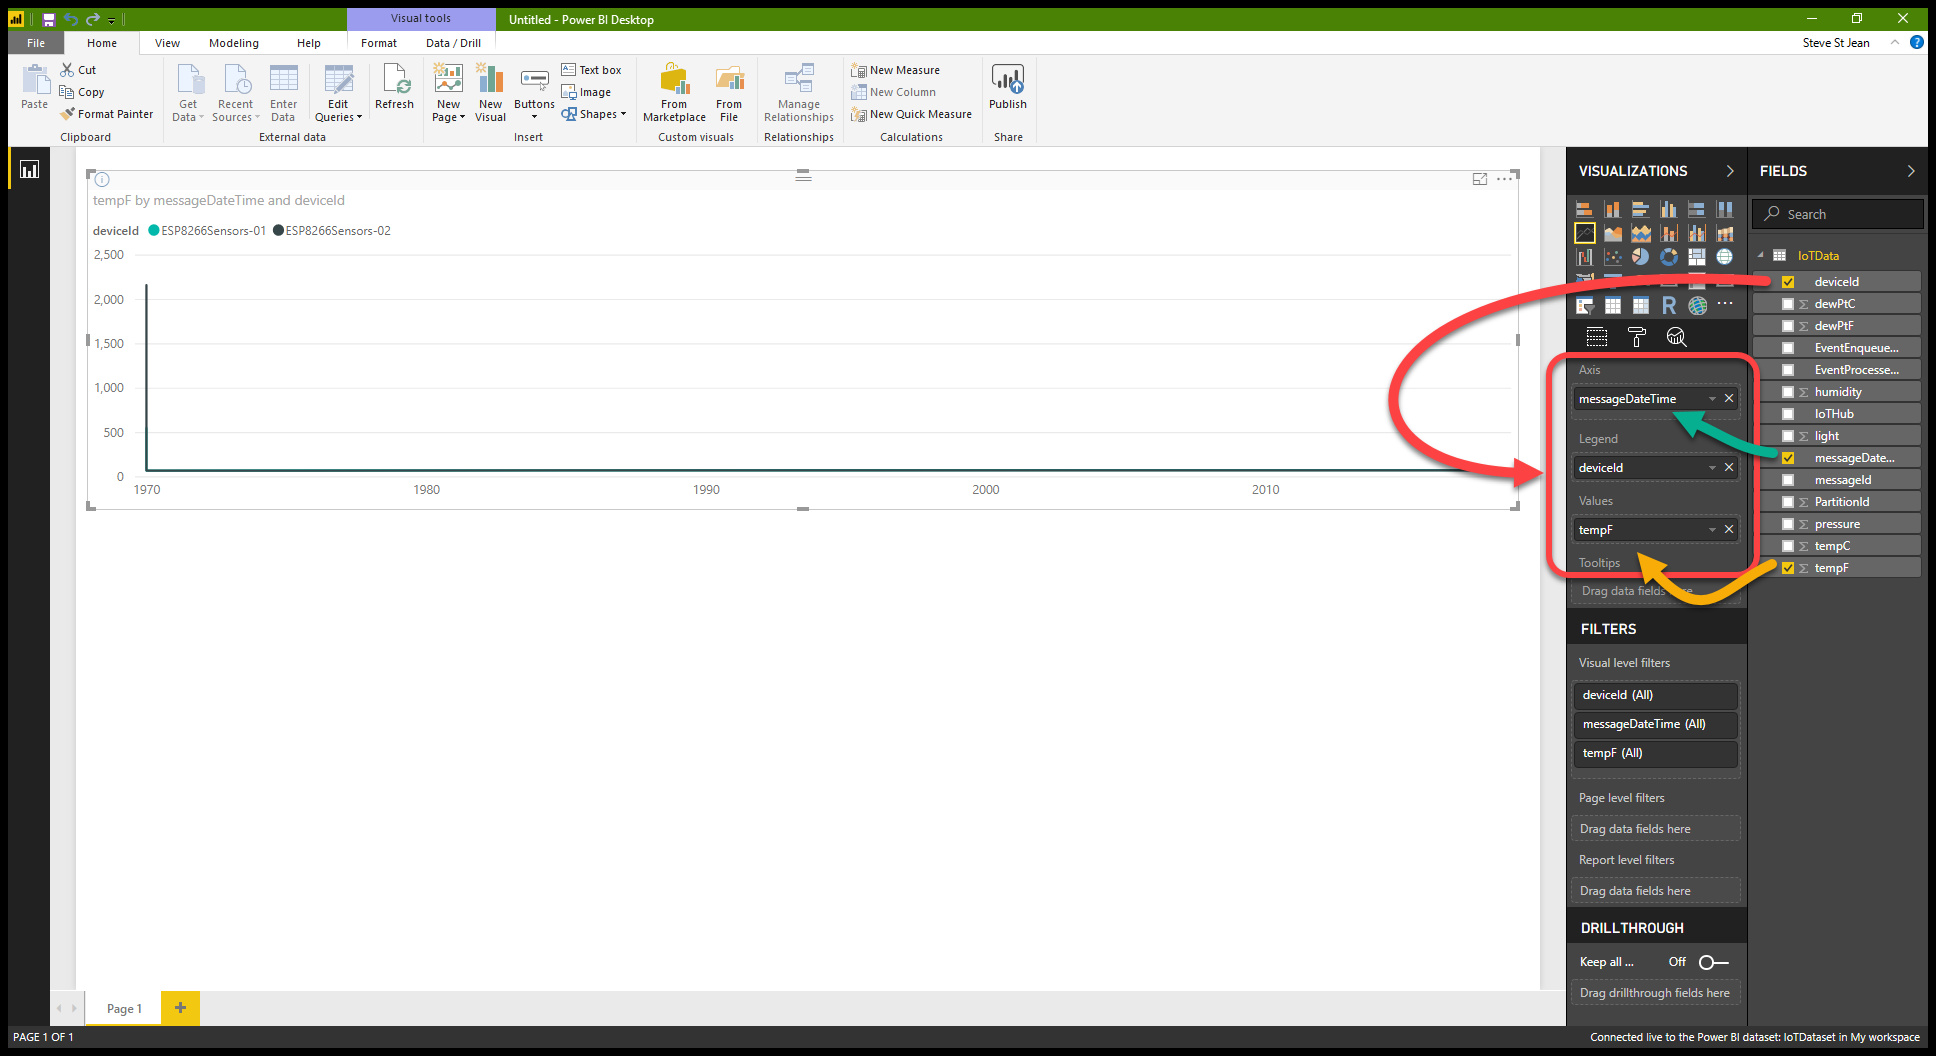
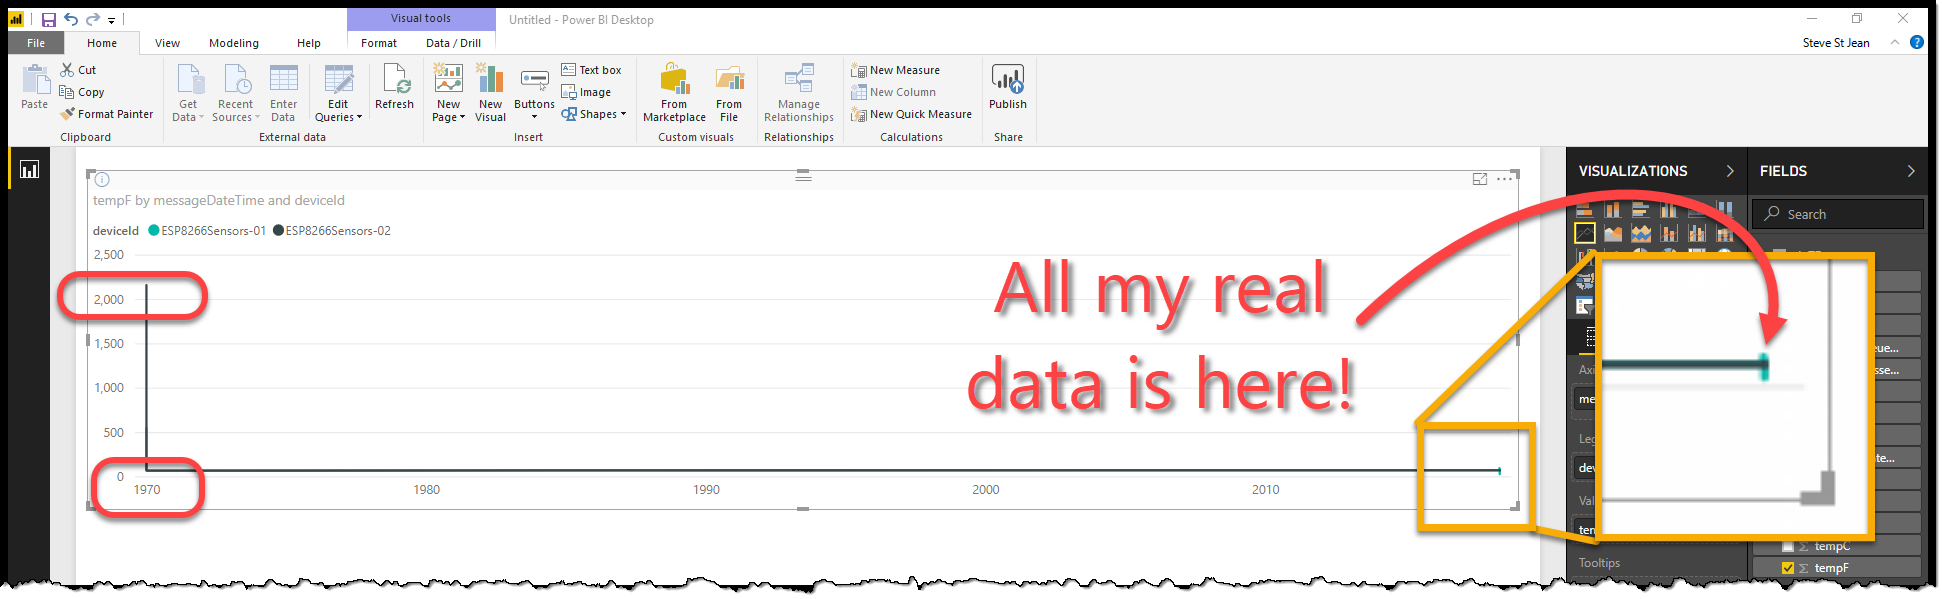
Now we can setup the data. Note that the section under the Visualizations secion has changed. We need to populate those fields with our data fields. Drag the
messageDateTimefield into the Axis slot, drag thedeviceIdfield into the Legend slot and drag thetempFfield into the Values slot. This should graph the Temperature over time with one line per sensor rig.
-
Not that my data has been graphed and it doesn't look anything like a graph. There is a spike on the far left showing the temperature over 2000°F and the date is sometime in 1970. This is totally messing up my graph because it's showing so much time, and the maximum temp is so high, that all of my real data is scrunched up in the bottom-left corner. What's going on??
Debugging data issues
-
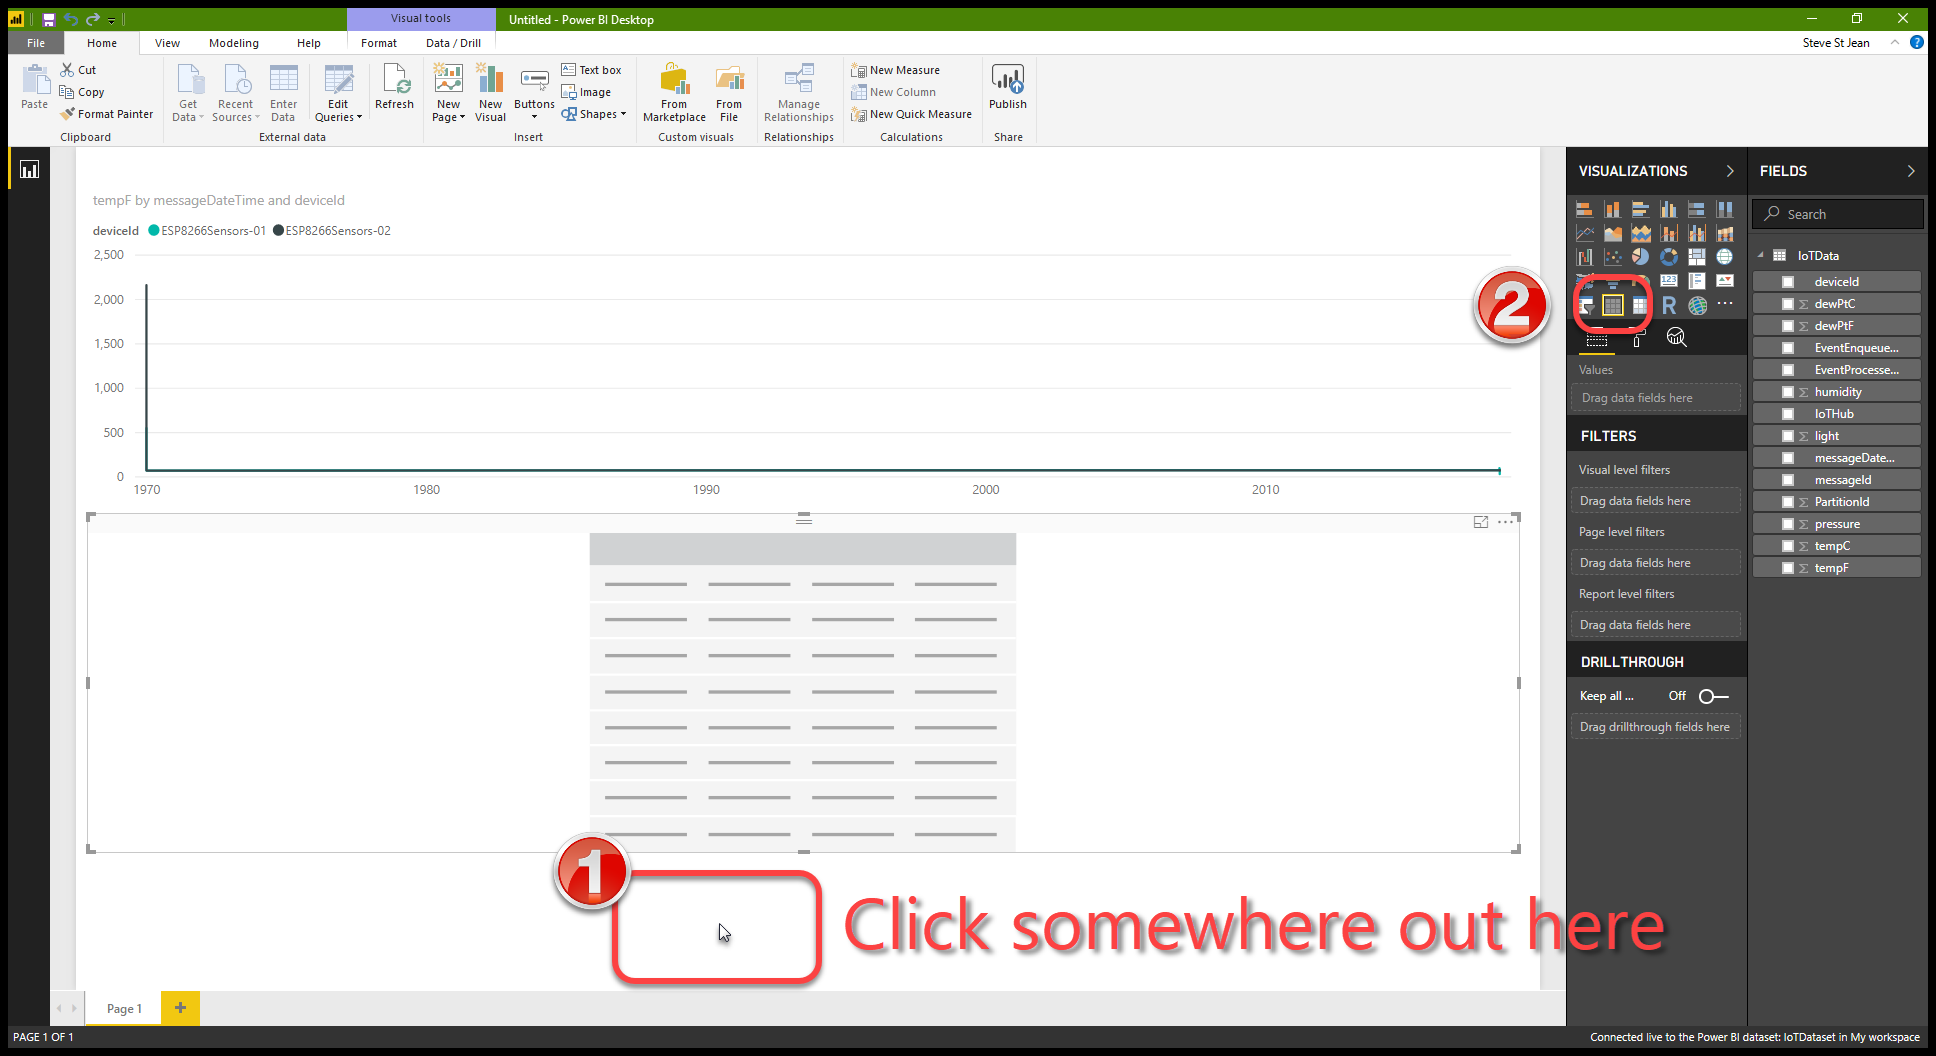
Let's debug this issue. The first thing we need to do is to see what the data looks like. We can easily do that by adding a second Visualization. First, click in the blank part of the workspace to deselect the line chart. If you don't do this you will change the line chart to a different visualization. Next, go to the Visualizations section and click on the Table icon. This will add a table below our line chart.
-
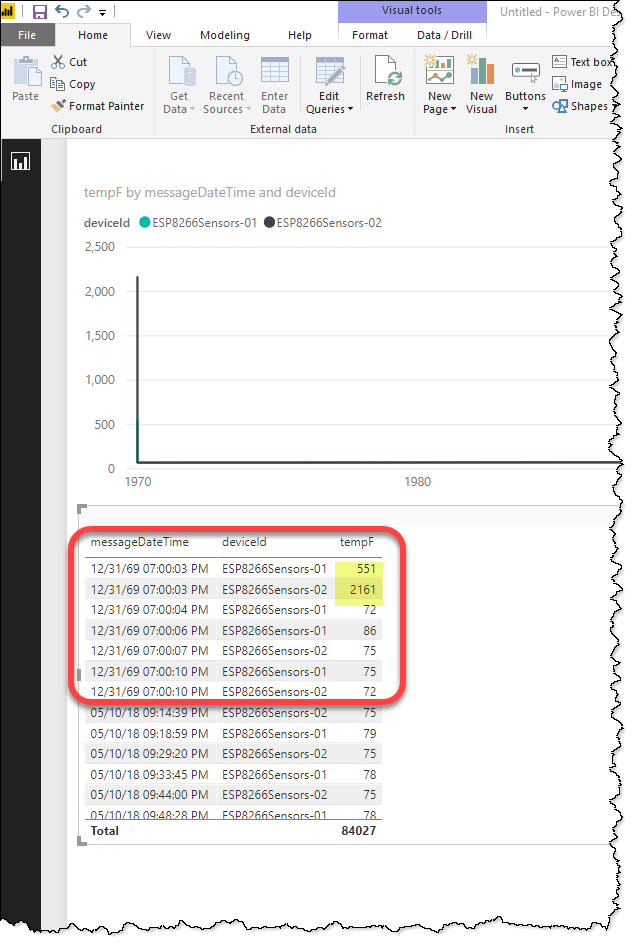
Now let's populate the table with data. In the Fields section, check the box next to
messageDateTime,deviceIdandtempFin that order. This will create the table with those columns showing up so that we can see where our problem lies. Looking at the data we see that some garbage data is in our dataset. The first 7 entries are from 1969, and the first two entries have impossible temperatures.
Fix the problem and continue
-
When developing the code for the sensor rigs, I built the Upload to Azure code before I had all the sensors and date/time stuff working. These entries are probably from those tests as the date/time stamp is Unix Epoch time zero (0) converted to my time zone (UTC-5). Since I know they are bogus entries, I'll need to tell Power BI to ignore them. Luckily I can do this with a Filter on the
messageDateTimefield.
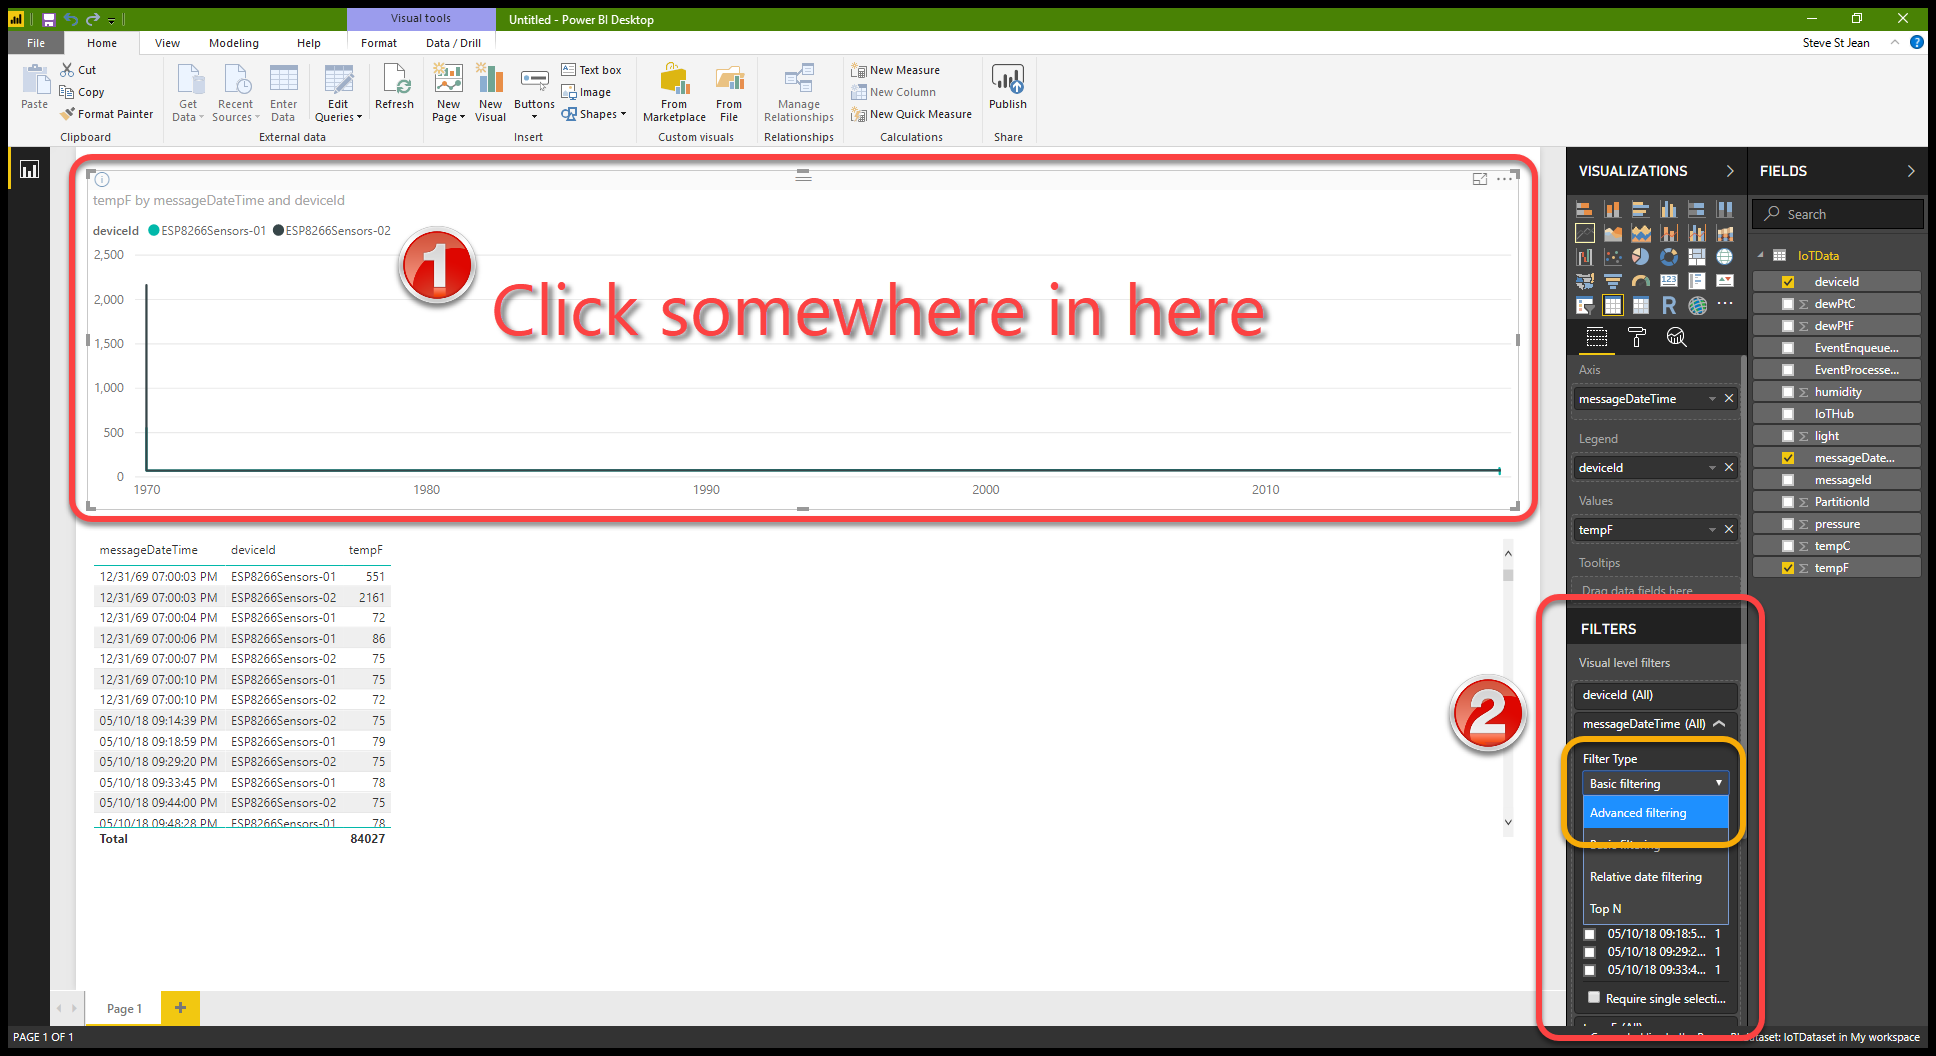
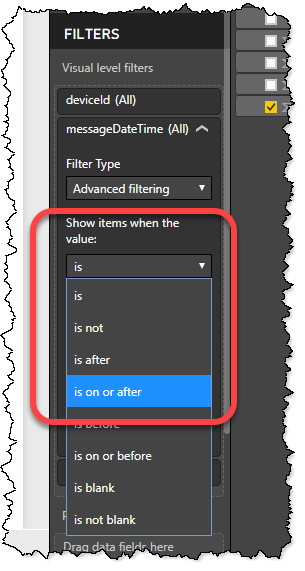
First, you need to select the line chart so that our changes will update the chart. Then, in the Filters section, expand themessageDateTimefield and change the Filter Type from Basic filtering to Advanced filtering.
-
The filtering criteria will change. Now we can tell Power BI to only use data after May 1st, 2018. In the drop-down under Show items when the value: change the selection to is on or after.
-
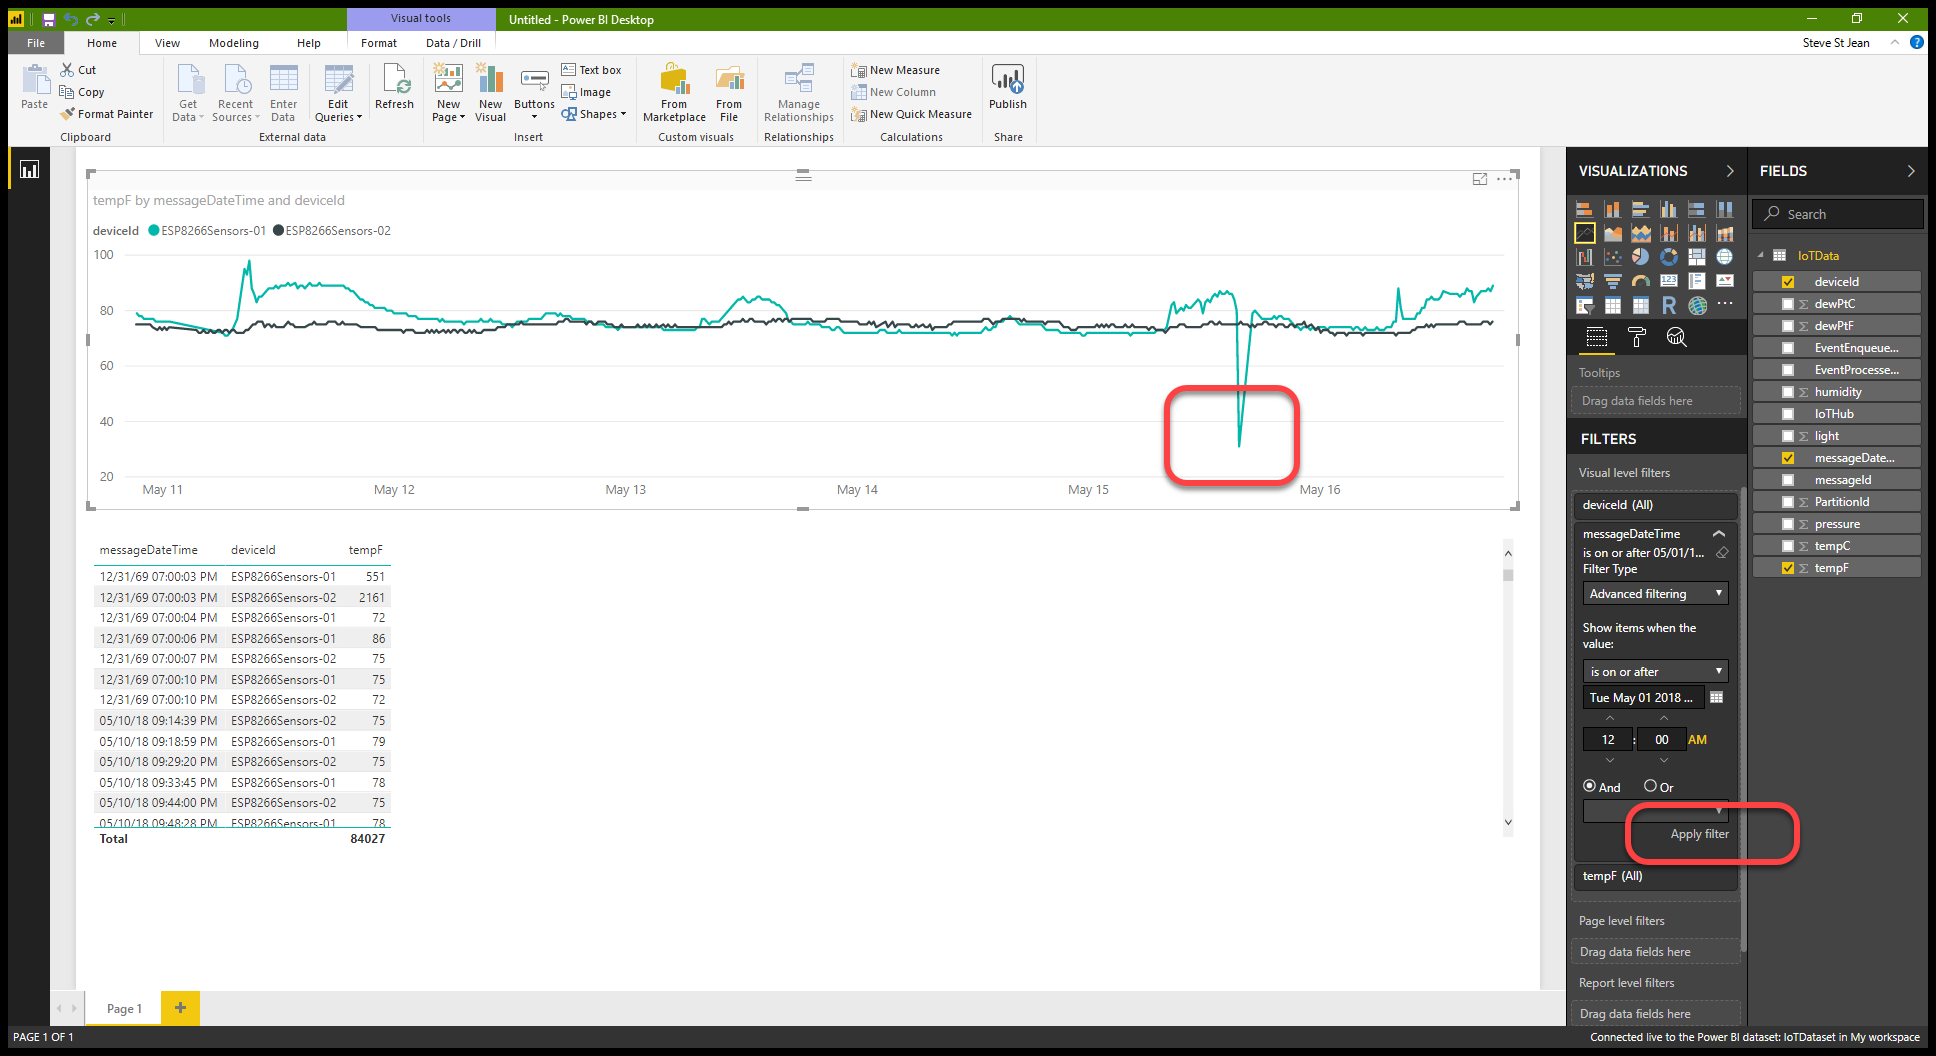
Then click on the Apply filter link to throw away the bad date range data. As you can see, our data now starts in early May, 2018 and we can see two lines on the chart, one for each sensor rig. Now I do notice that the lines are pretty squashed together which makes it hard to interpret the data well. I can also see a downward spike late in the day on May 15th. This low reading (31°F) is way out of the normal for May in Florida, so I'm going to have to filter it out as well.
-
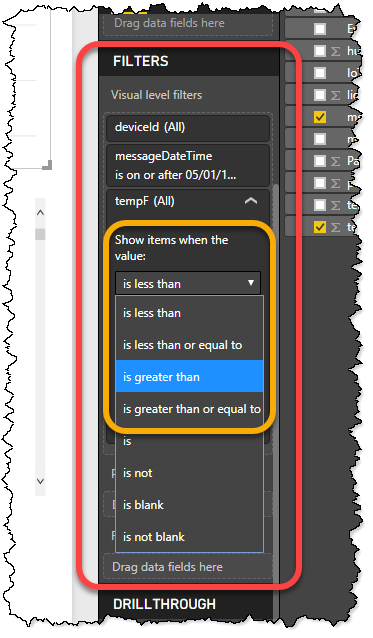
Let's go back to the Filters section and collapse the
messageDateTimefilter expression and expand thetempFfilter expression. In the drop-down under Show items when the value: change the selection to is greater than.
-
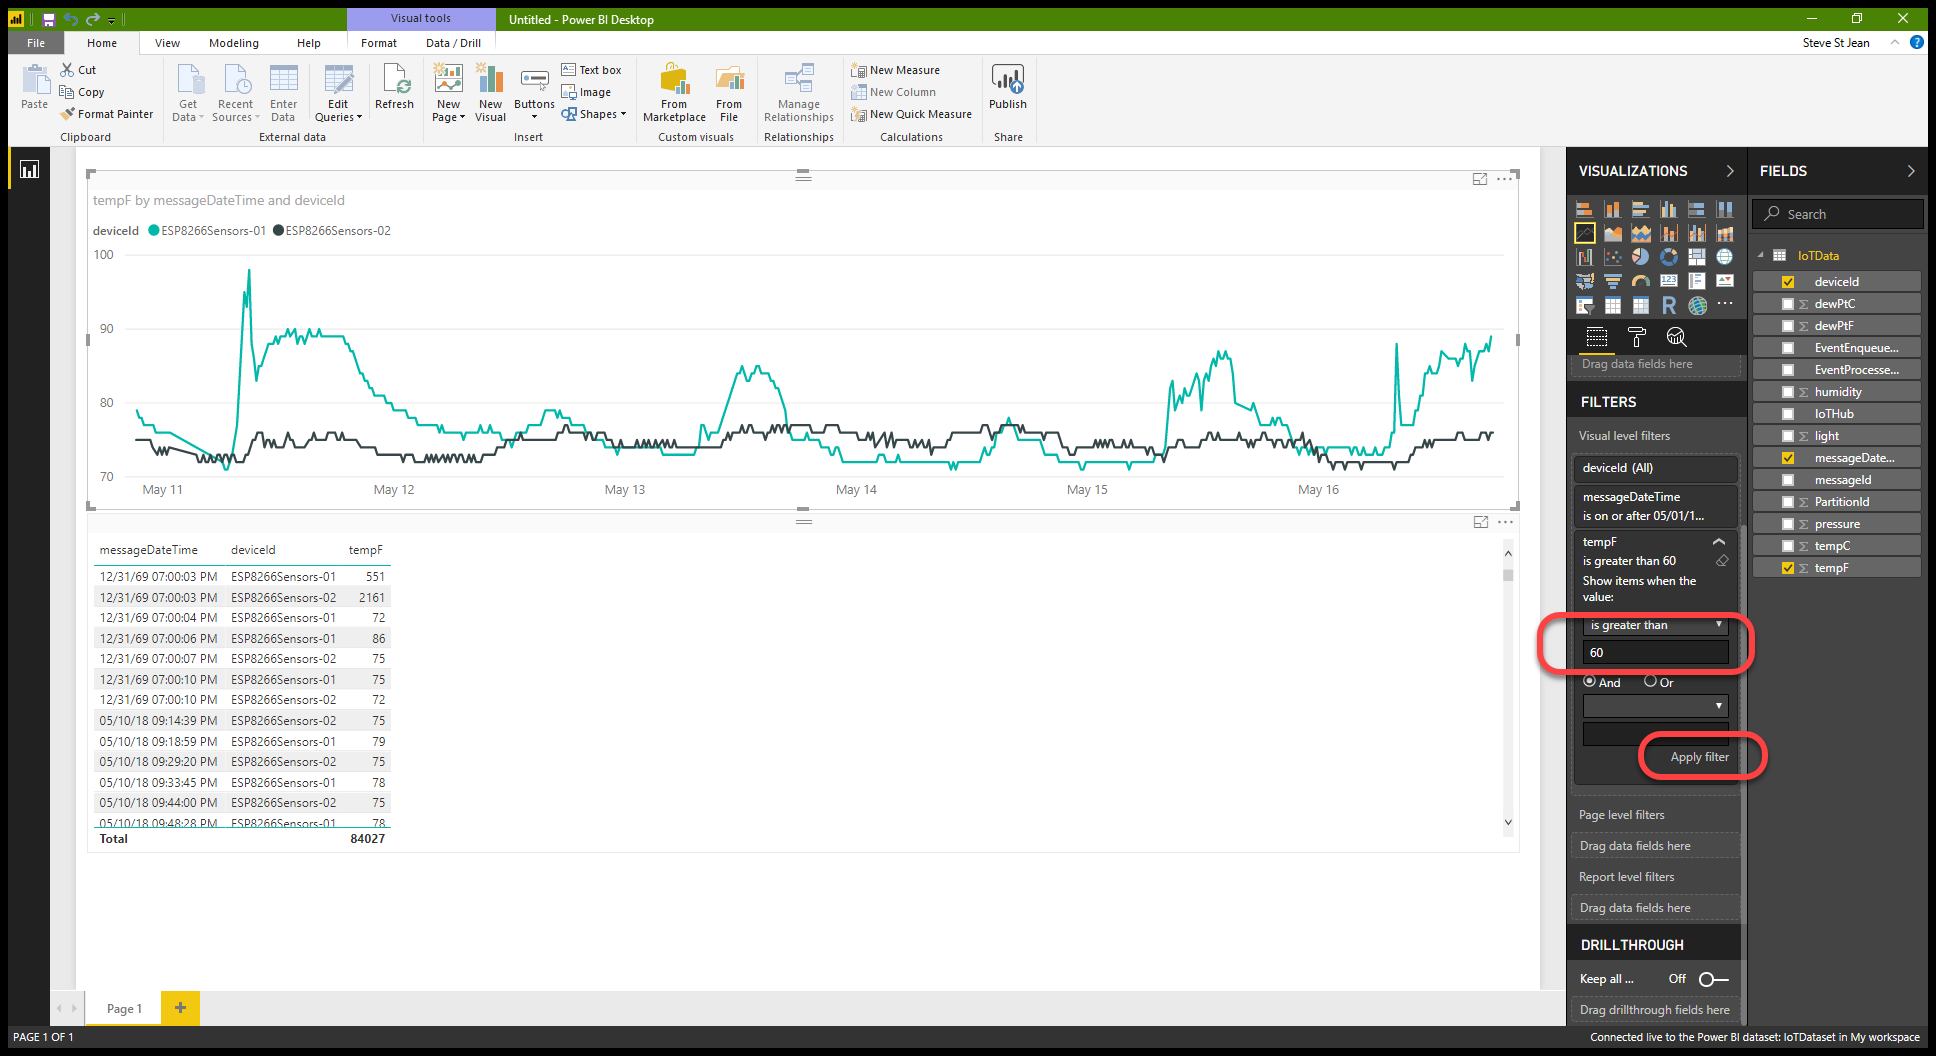
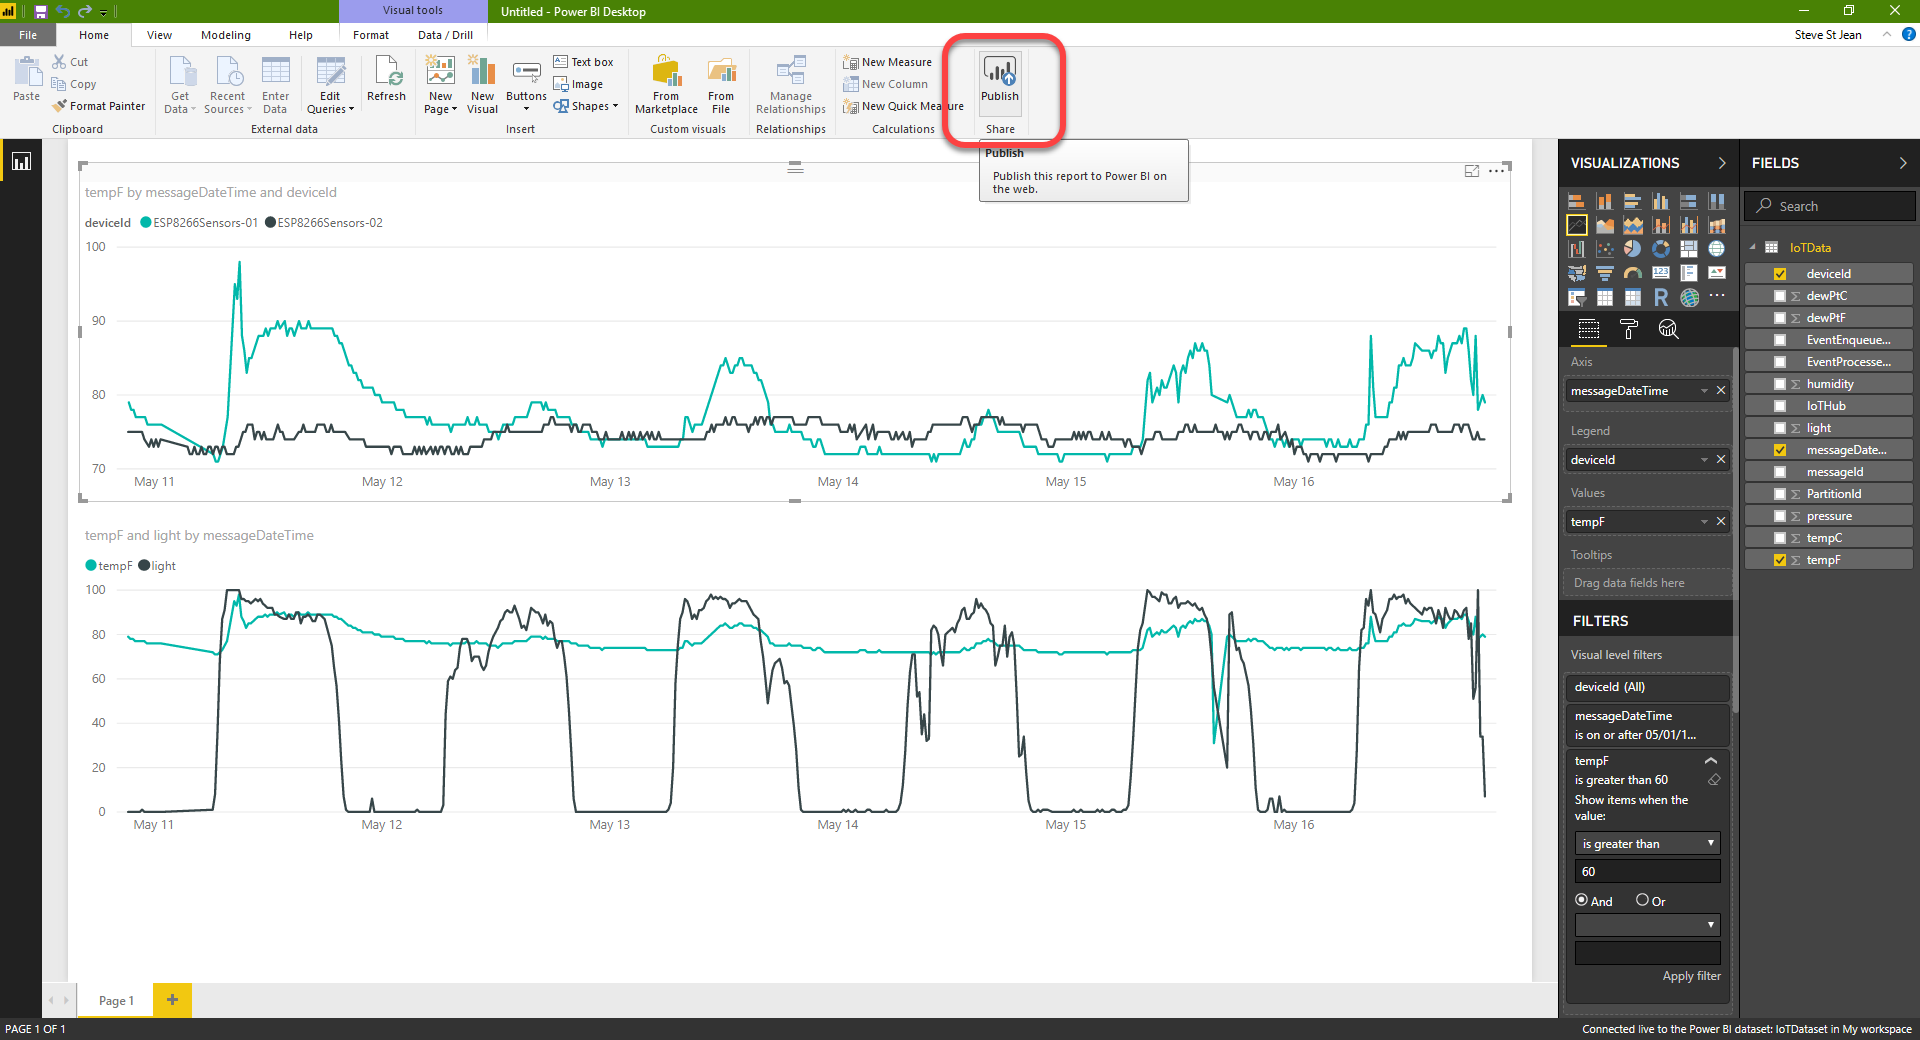
We can assume from our data that anything over 60°F is real data, so enter 60 in the
tempFfilter value field and then click on the Apply filter link to update our line chart. Ahh..that's much better.
-
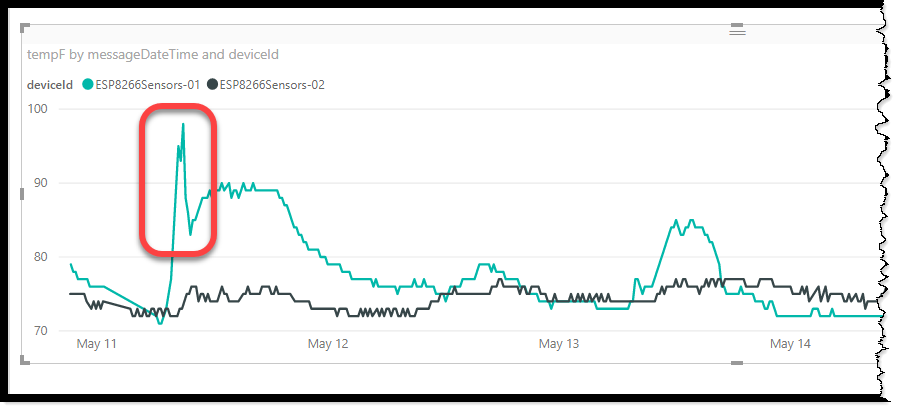
Notice that we have an upward spike that drops back down on May 11th. This is actually accurate data (somewhat). The
ESP8266Sensors-01rig is sitting on my back porch that faces East. The sun was directly hitting the rig and heating it up. As soon as the sun climbed high enough to leave the rig in shadow, it cooled back off. I probably should have found a more sheltered location for this rig to cut down on skewed data like this. We could filter this high out, but I'm going to leave it for now.
Add a second line chart for the outside sensor data
-
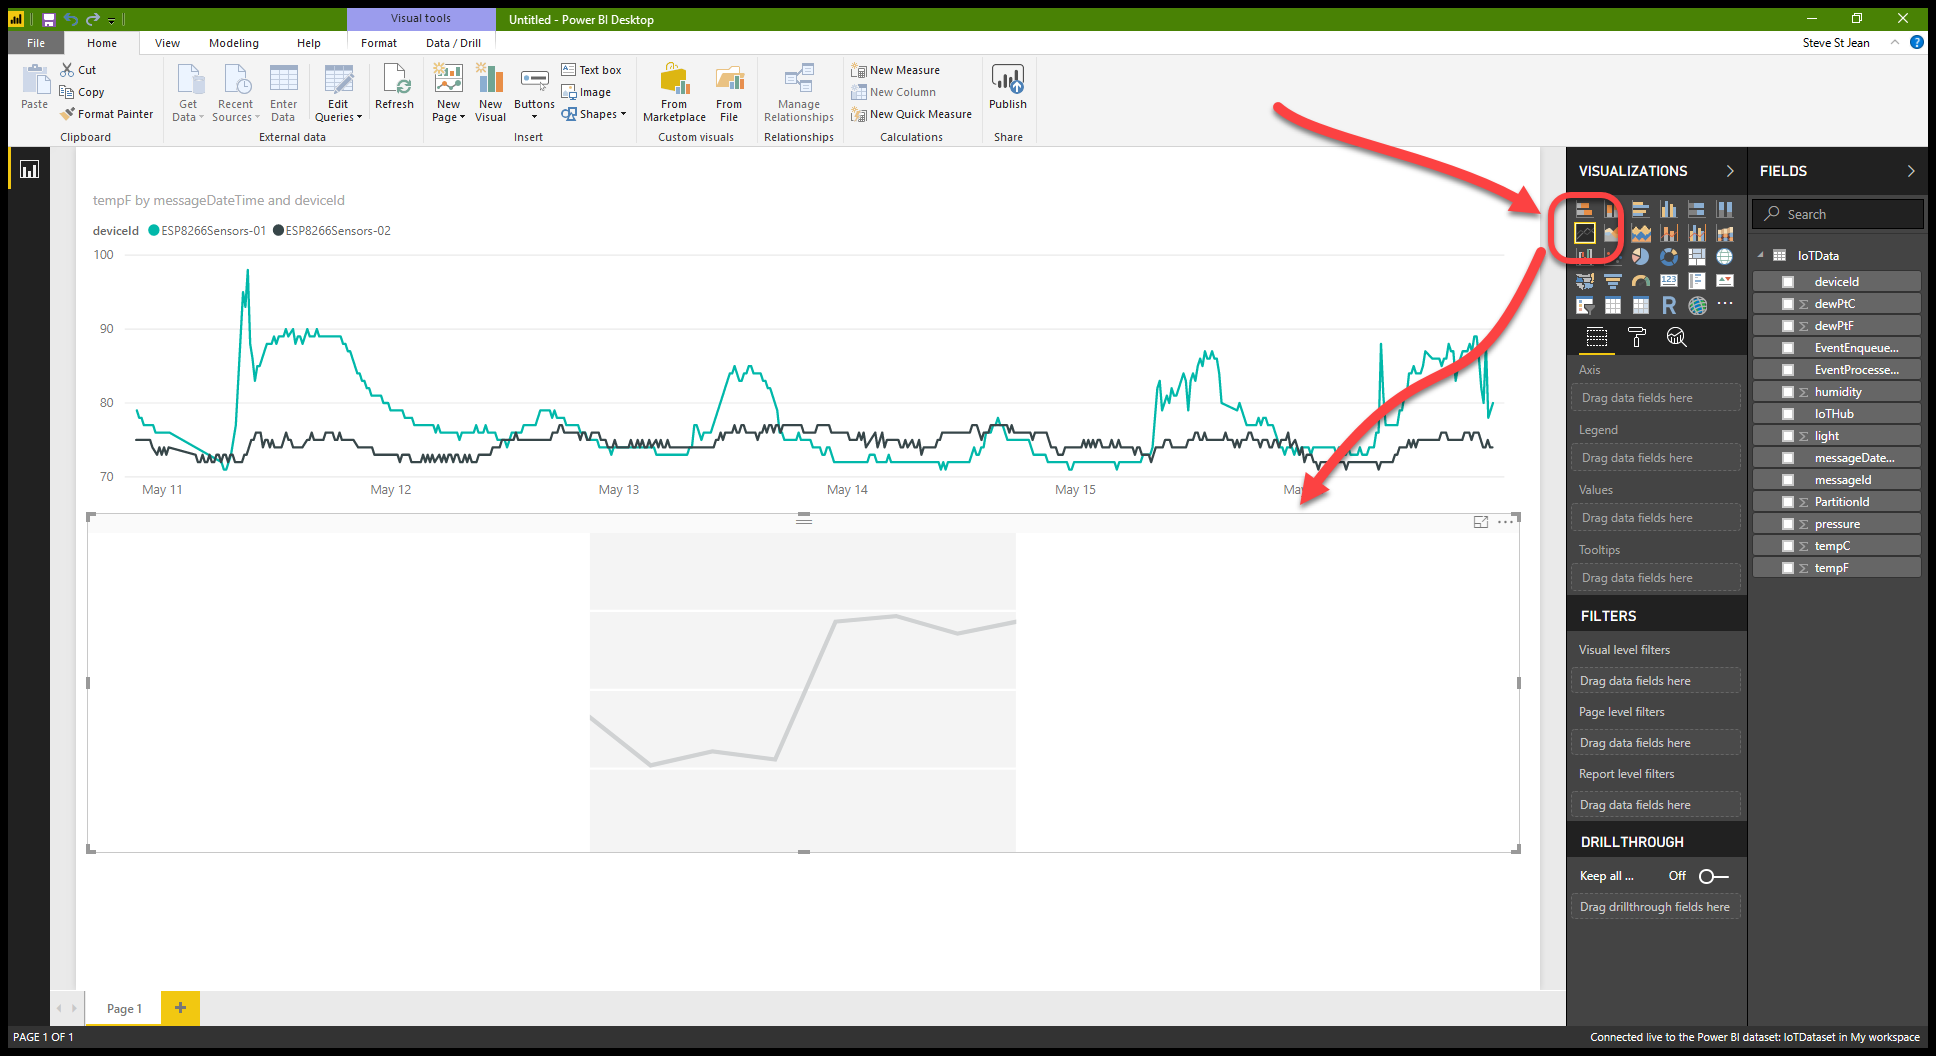
We've charted out our temperature data from both sensors, but I want to see the correlation between the temperature and light from the outside sensor over time on a single graph. To do this I'm going to delete the table we added back in the Debugging section by selecting it and pressing Delete. Now add another line chart to the workspace.
-
Ok, drag the
messageDateTimefield into the Axis slot. Then drag thetempFandlightfields into the Values slot. You will see something that doesn't look like time series data for these fields.
Add a Page level filter to fix the wacky date thing once and for all
-
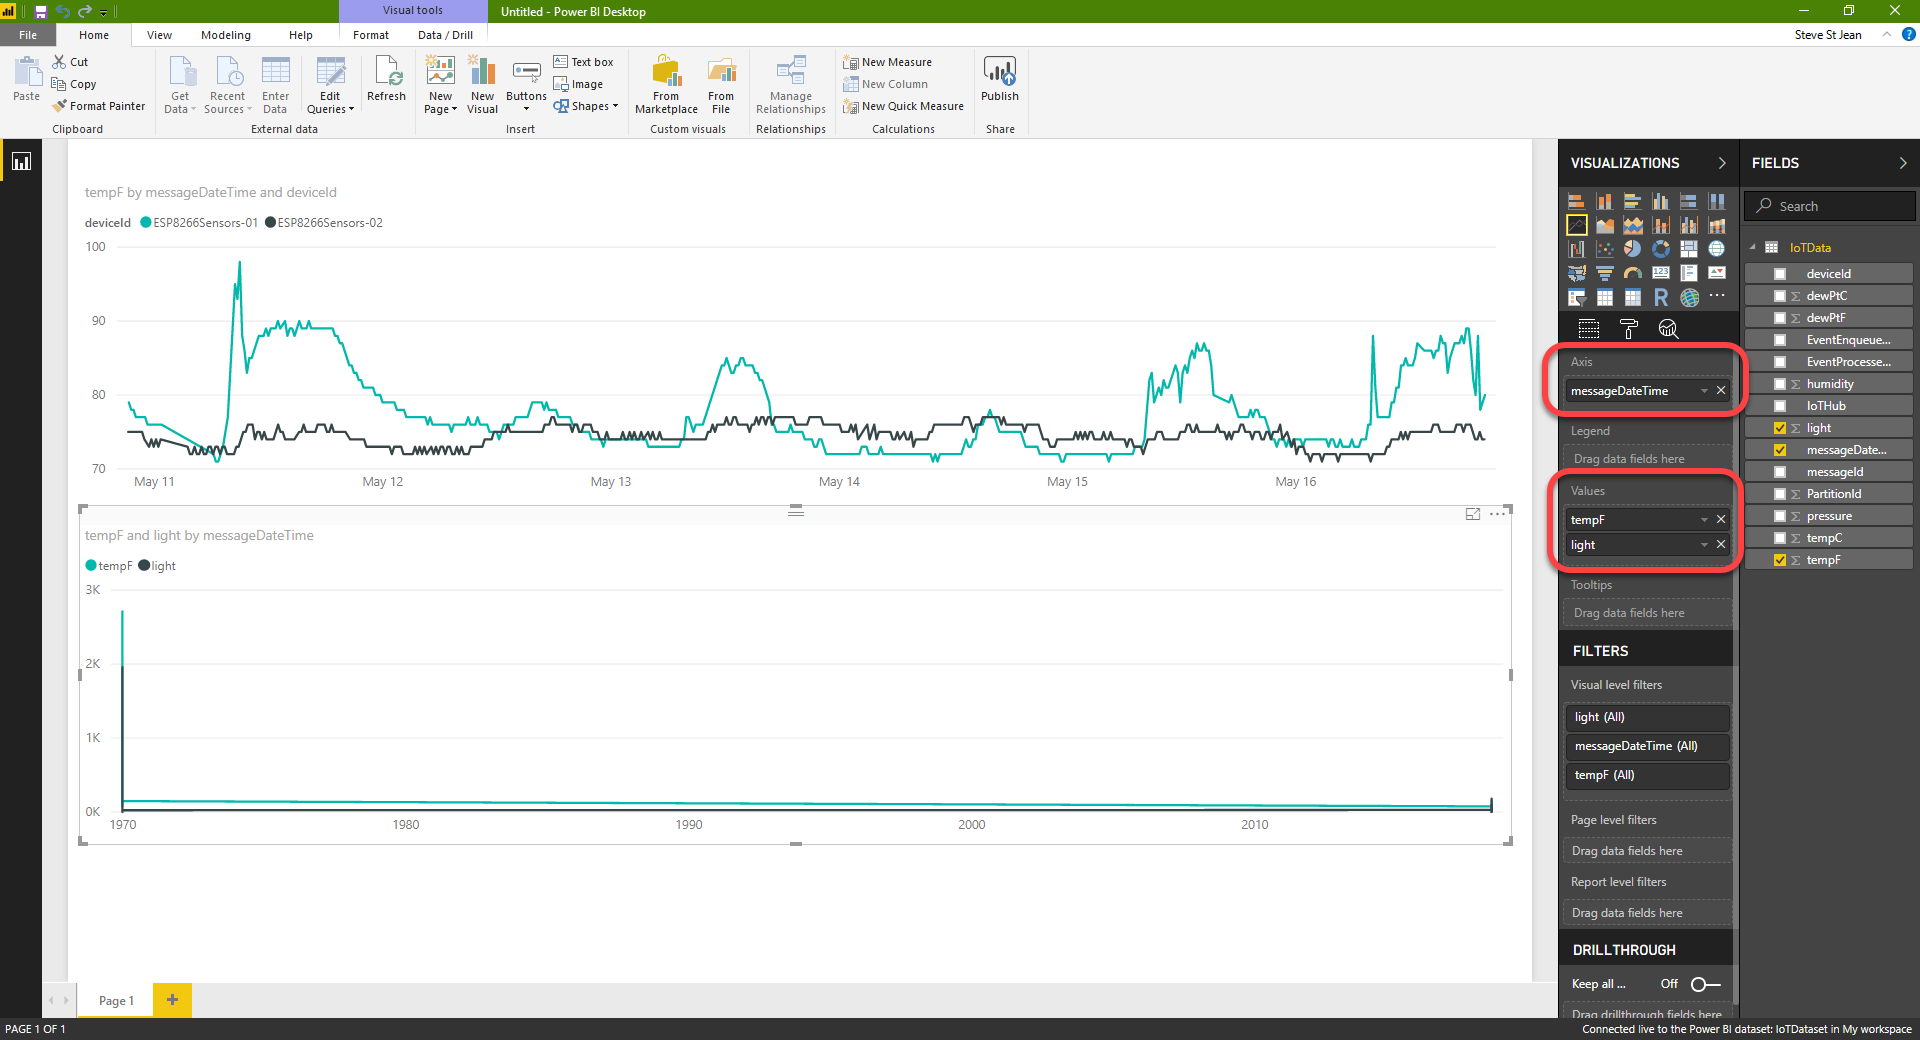
Oh, that's right...we have some bad data to filter out from when my sensor rig time-travelled back to 1969. Having to set these kinds of filters on every chart can be a pain. I'm going to set a Page level filter on this whole page so that any new charts I add will automatically filter out the bad, old dates.
-
Scroll down to the Page level filters section of the Filters block. Drag the
messageDateTimefield from the Fields list into the Page level filters slot. Now set the Filter type to Advanced filtering like we did earlier on the first line chart. Then set the Show items when the value: field to is on or after and set the date value to May 1, 2018 and click the Apply filter link.
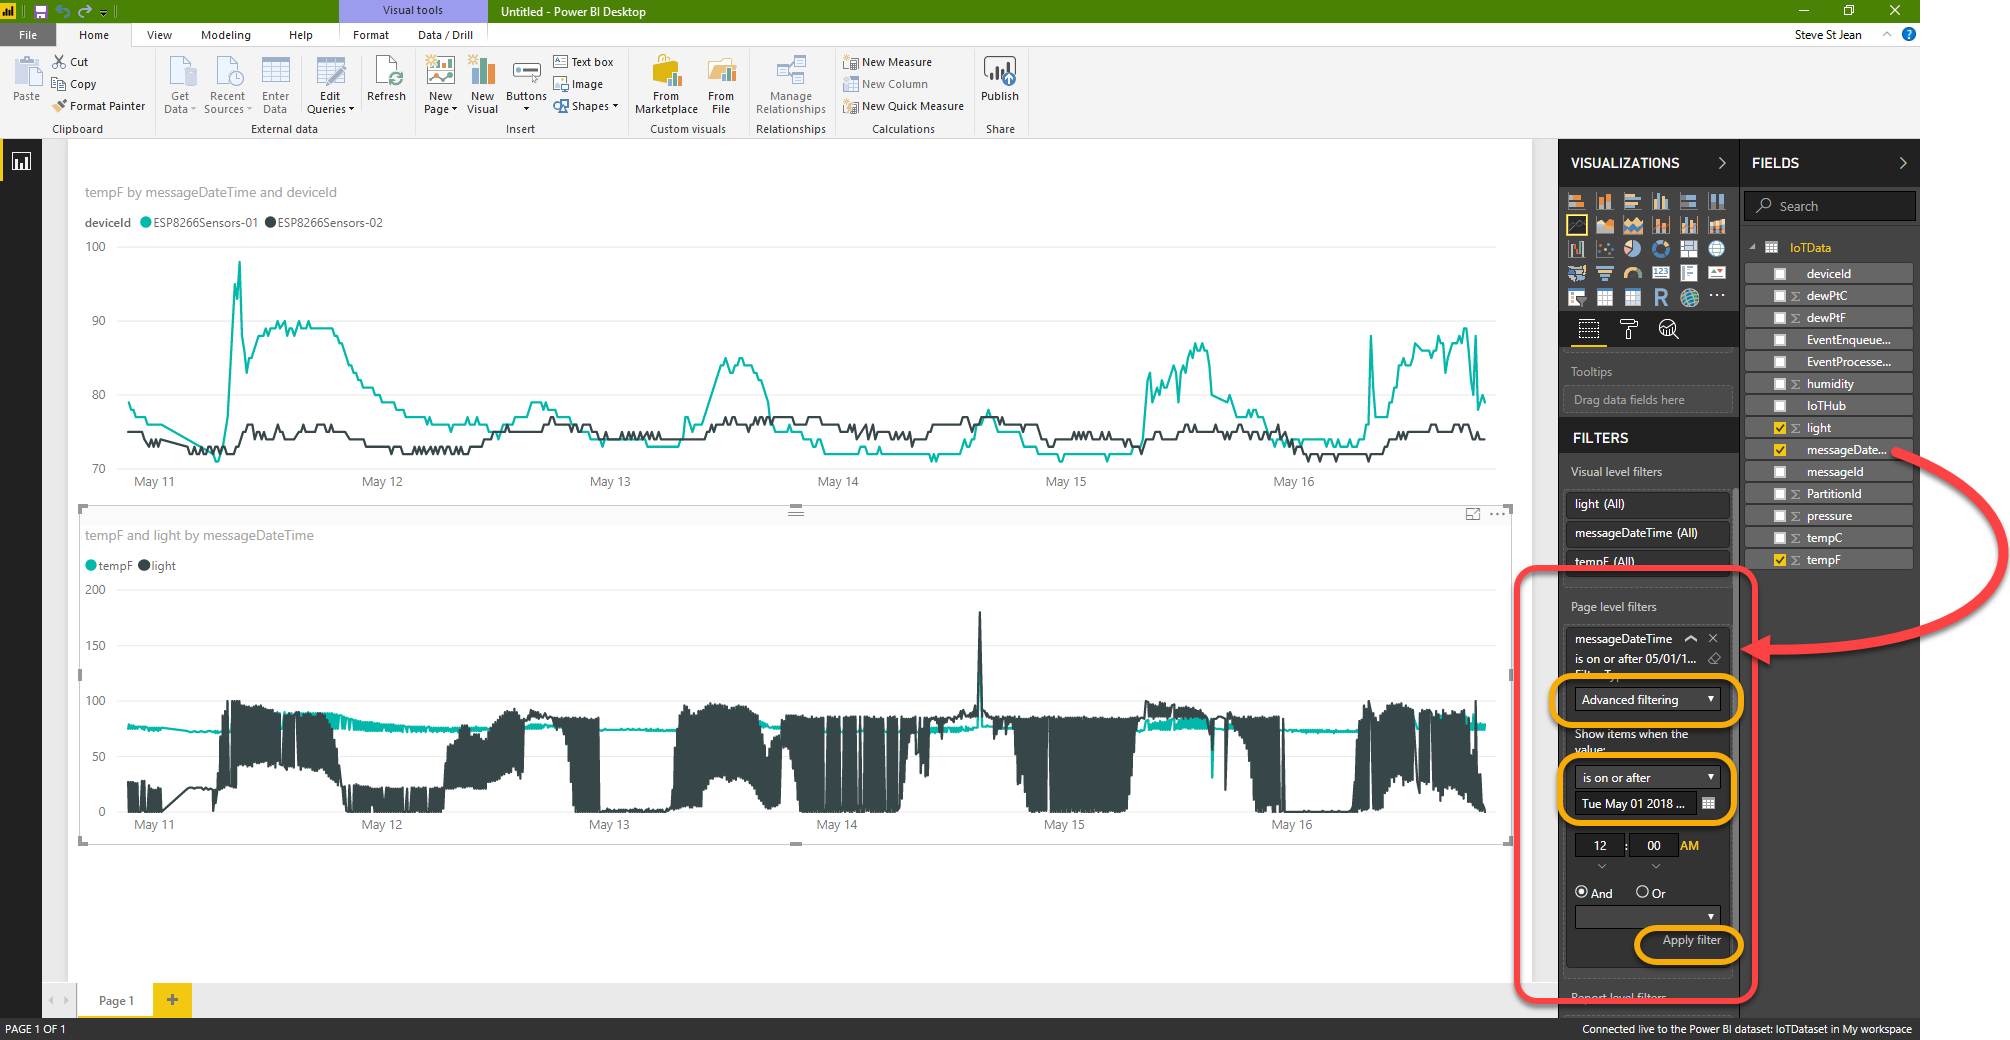
At this point you could remove the filter you applied to the first line chart and that chart would still look the same. -
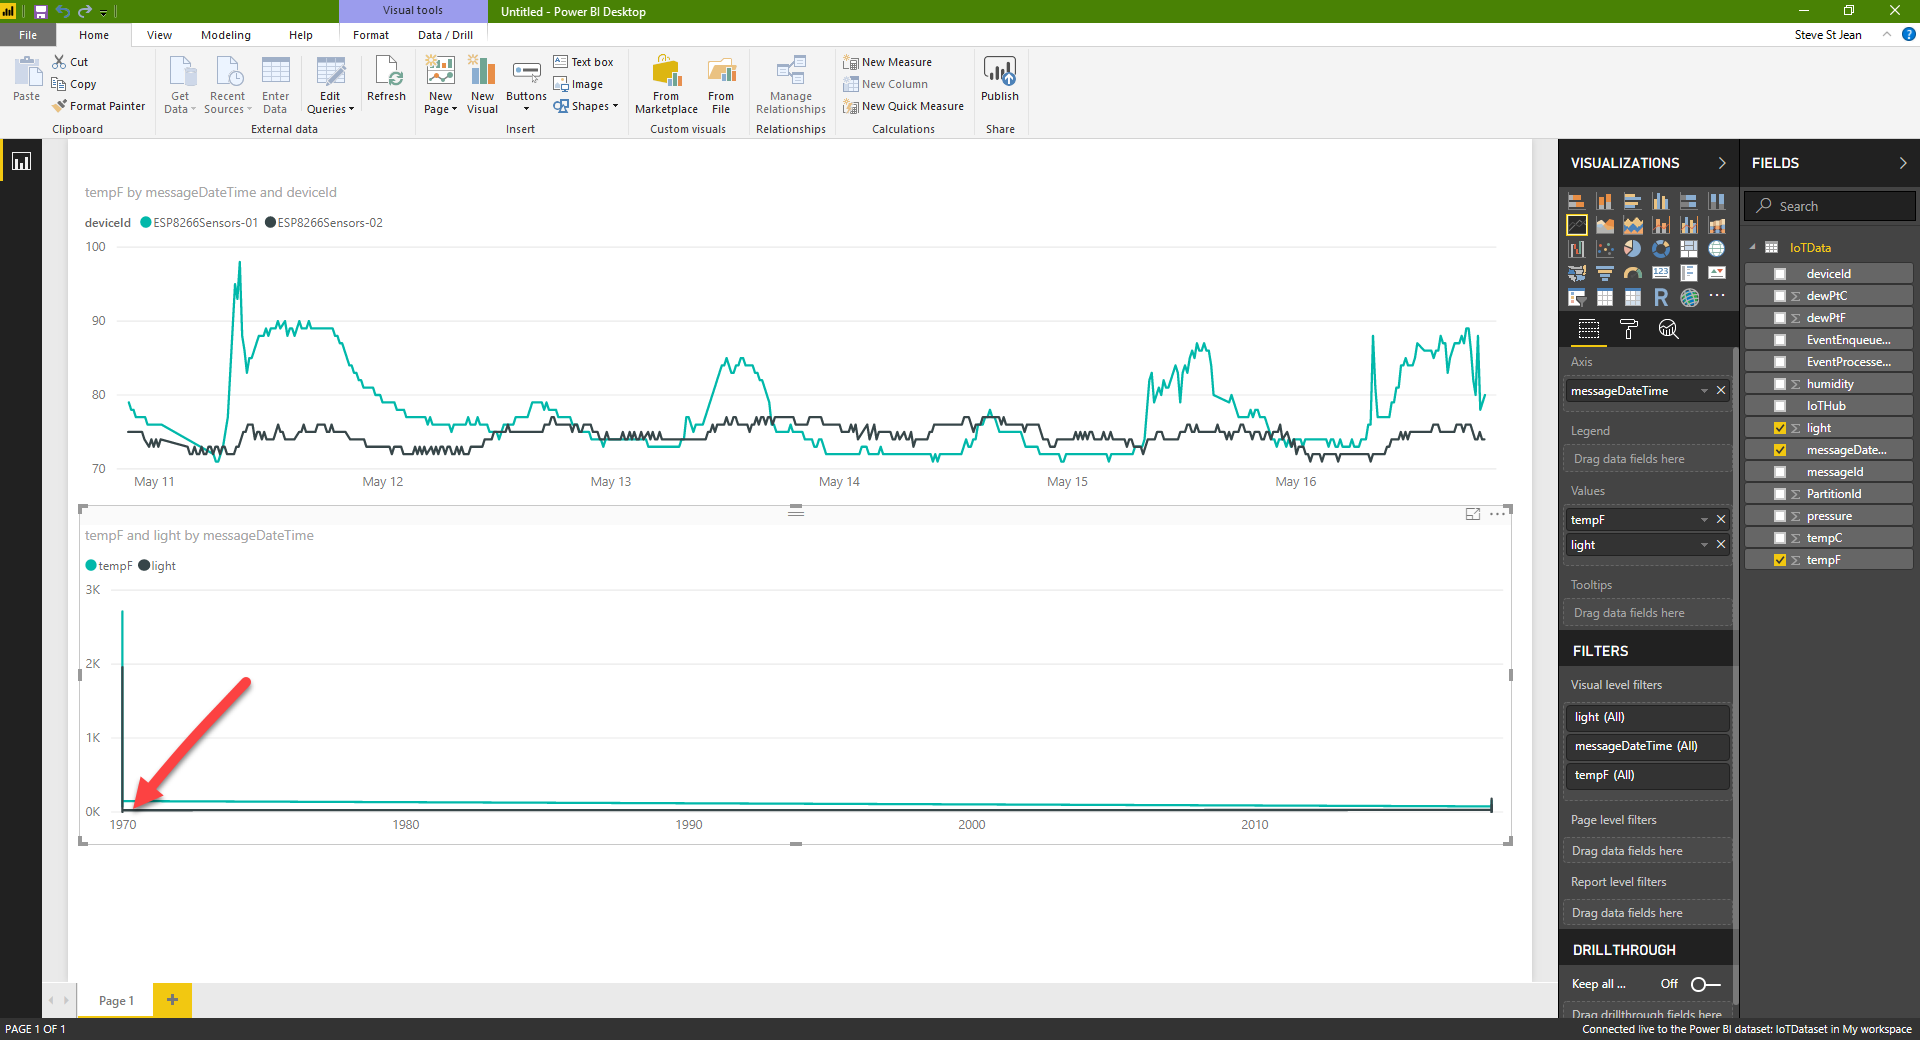
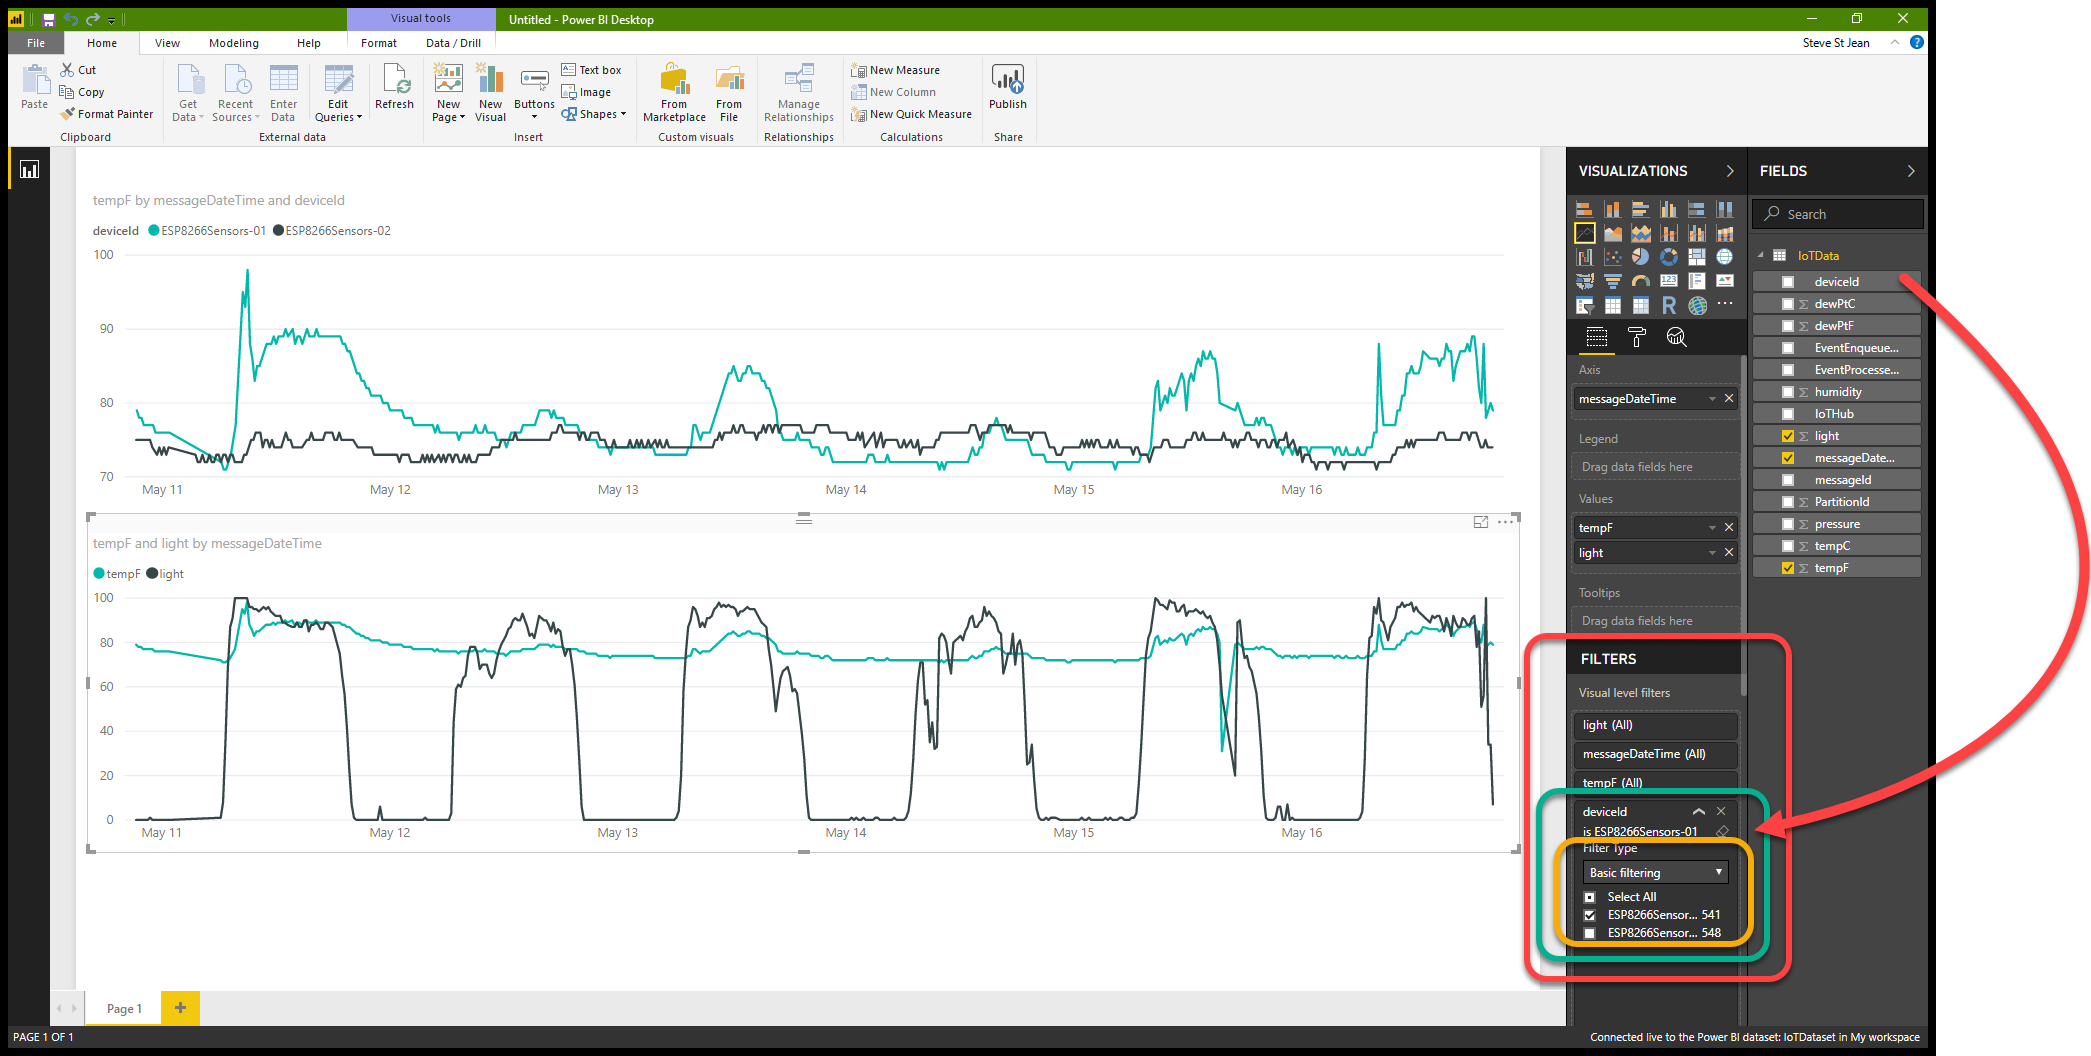
This chart data is all over the place. It should be a smooth line from point to point but it's got a ton of jitter. Looking at the top line chart, there's no way that the temp line should look like that. Oh wait, we haven't told the chart to only show the outside sensor. It's showing data from both sensors combined. Let's filter down to just
ESP8266Sensors-01. Make sure the second line chart is selected in the workspace. Drag thedeviceIdfield into the Visual level filters slot. The Filter type defaults to Basic filtering, so all we have to do is select theESP8266Sensors-01checkbox and the chart will clean up nicely.
Publish our charts to Power BI
-
Now that our charts are all set we can publish them up to Power BI. In Power BI Desktop, click on the Publish button in the Home ribbon.
-
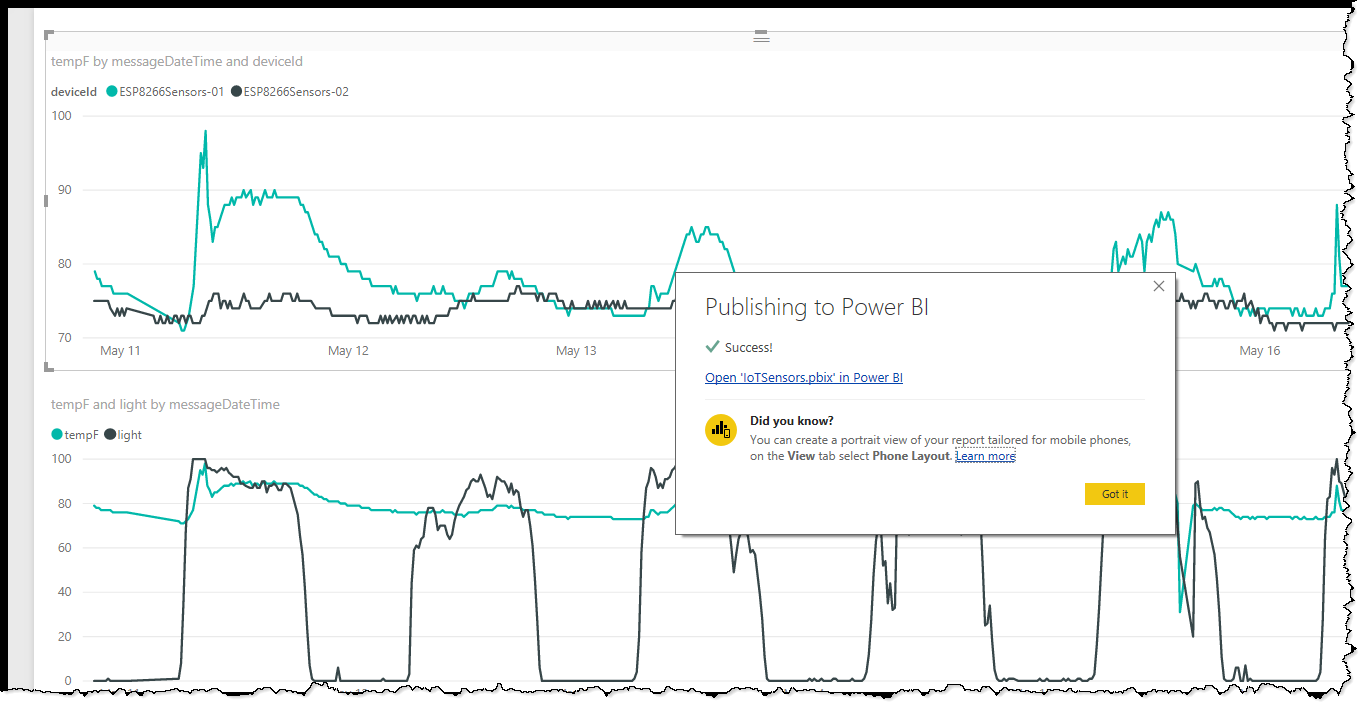
You should see an In Progress message and then a Succeeded message.
-
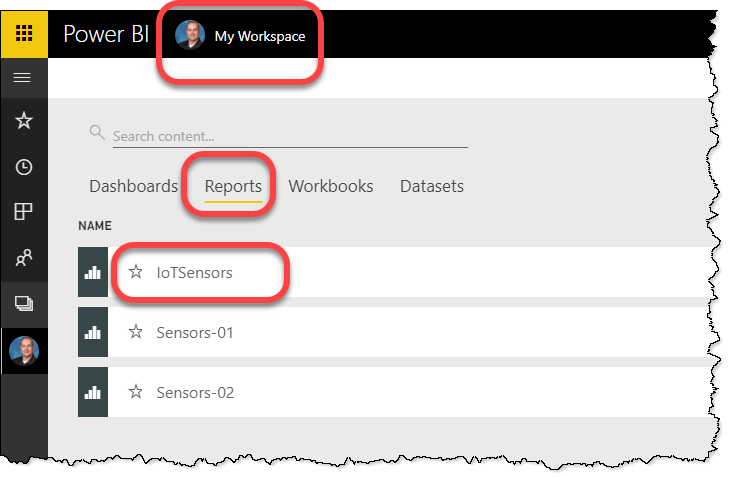
Now open a browser and go to your Power BI instance. Navigate to My Workspace then select Reports and you should see your published report.
Create a Live Dashboard for our report
-
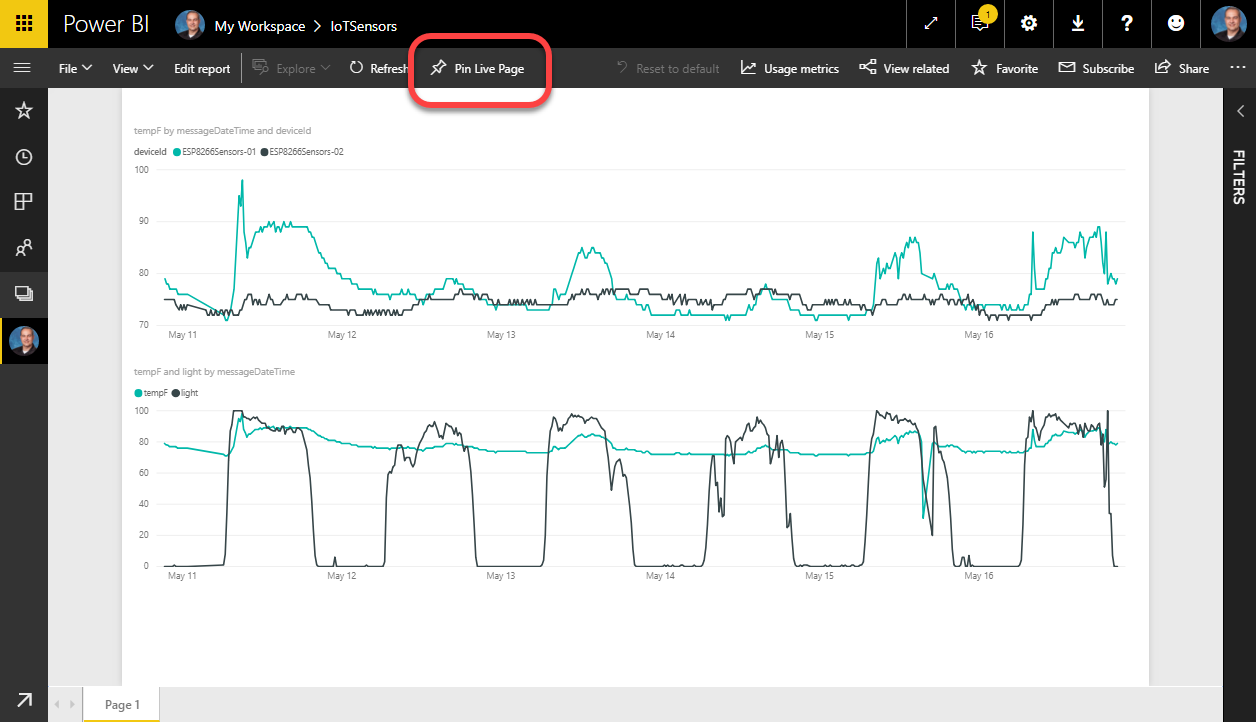
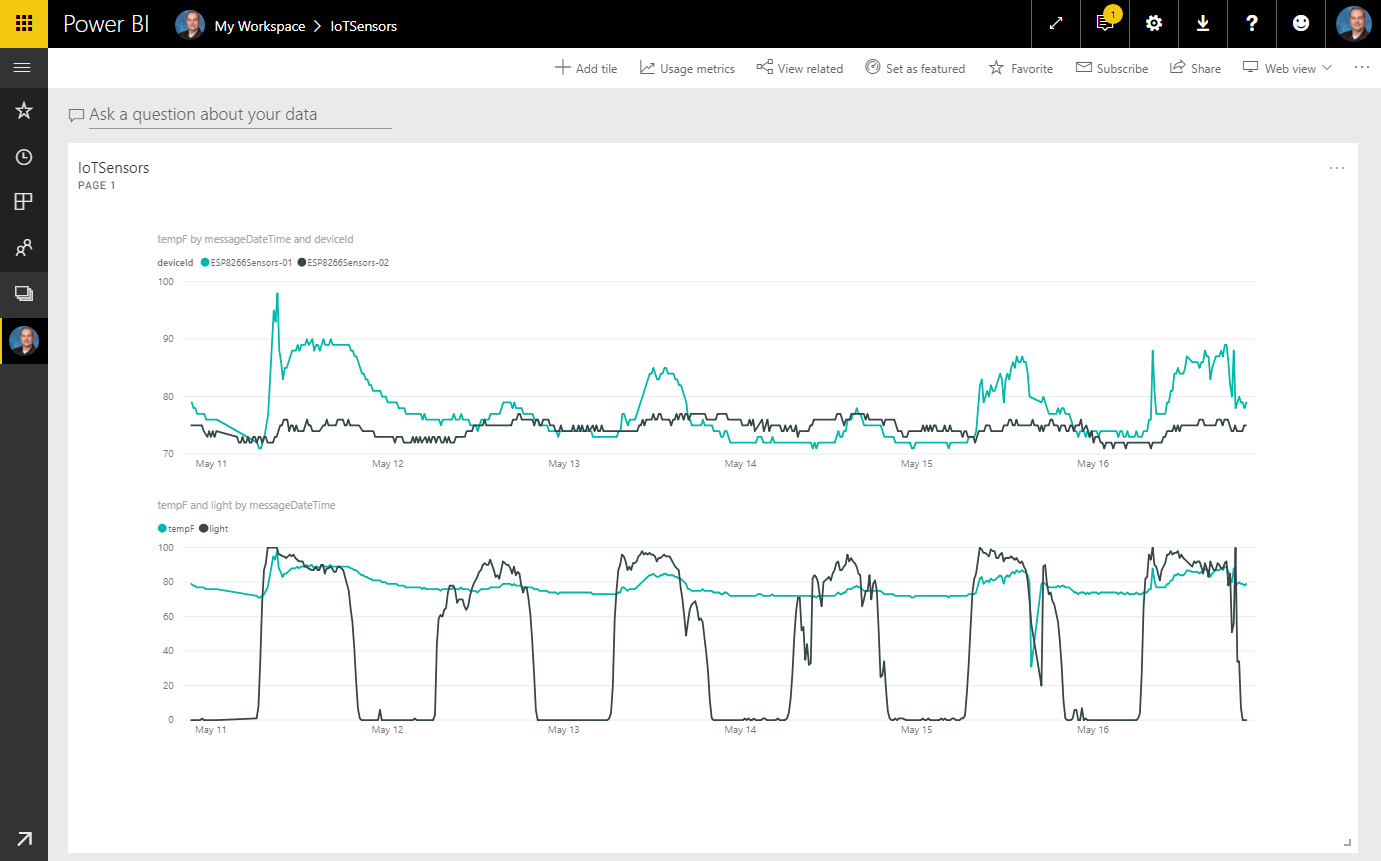
Now you will see the report you published from Power BI Desktop. Wouldn't it be nice to be able to view these charts on a dashboard? Let's click on the Pin Live Page button to do just that.
-
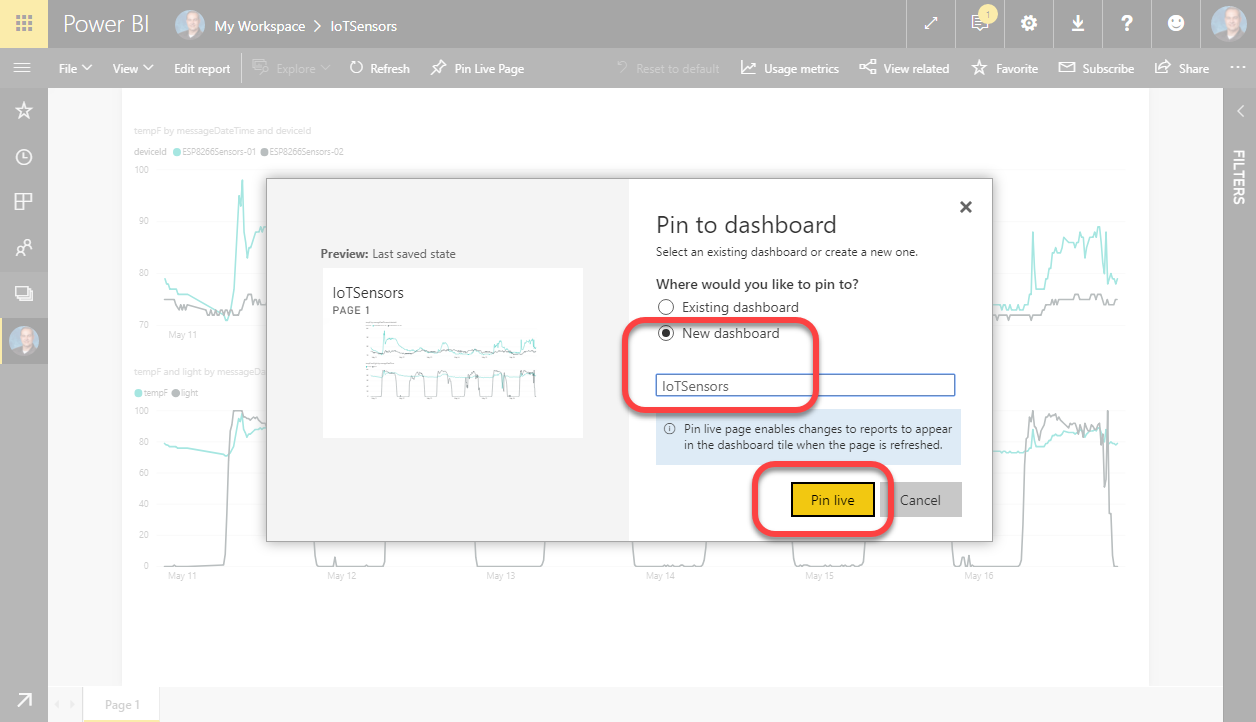
Pin Live Page is going to need to know where you want this report pinned, on an existing dashboard or on a new one. Select New dashboard and then enter a name for your dashboard. Once that is done click the Pin live button.
-
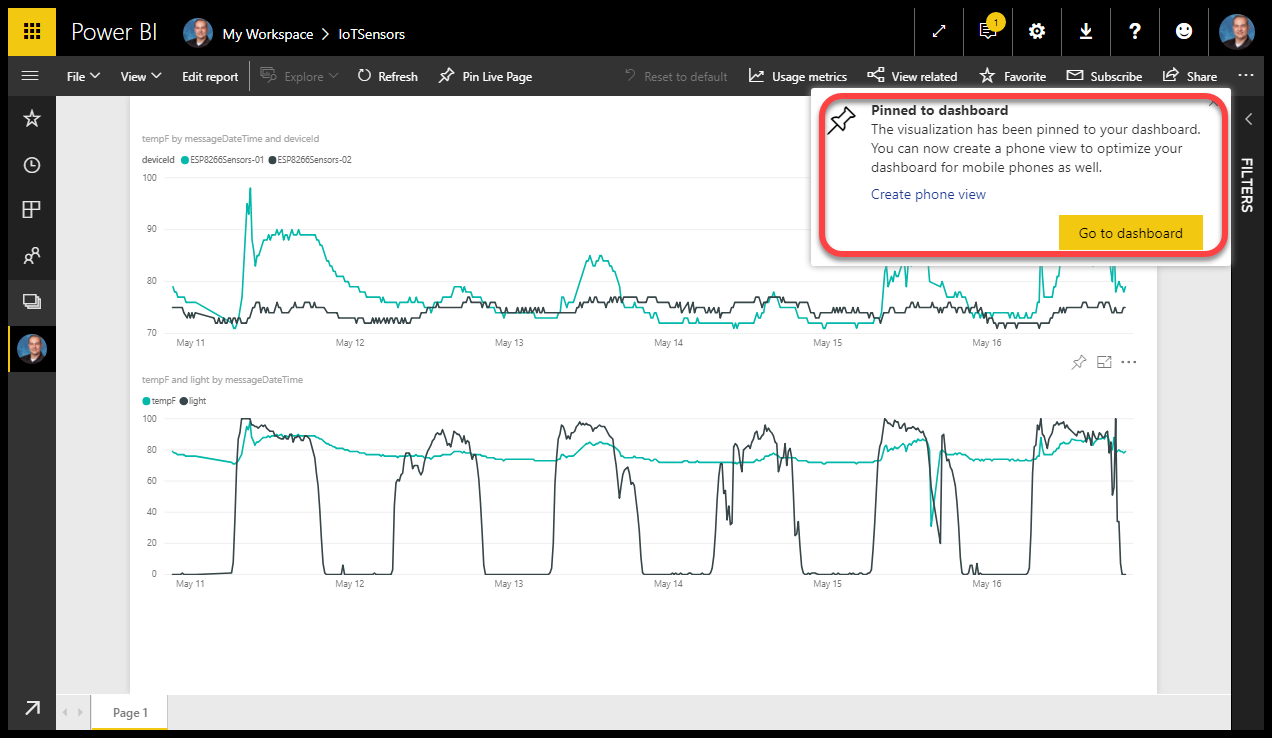
Once Power Bi has finished making the necessary changes it will pop up a message stating Pinned to dashboard. Click on the Go to dashboard button.
-
That's it! I can now view my data from anywhere I have an Internet connection. How's that for overkill. ;-)
-
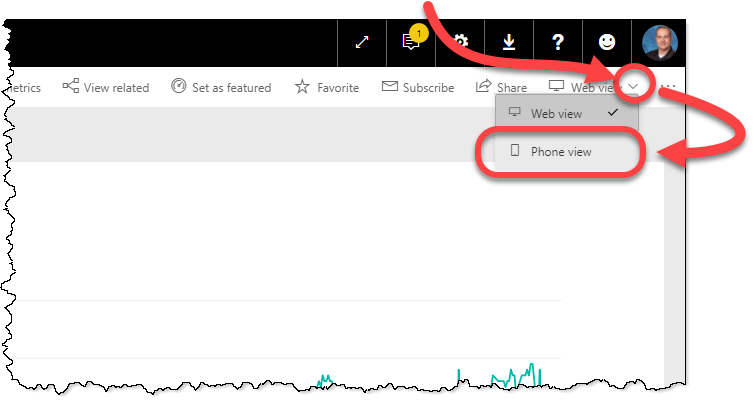
BTW, you can also configure your dashboard for Phone view.
Conclusion (for now)
Phew! We've come a long way in this Series. Does anyone even remember what problem I was trying to solve?
Oh yeah...figure out why my office is so hot, and figure it out in the most over-engineered way possible.
We've gone through creating a sensor rig (or two) to collect environmental data. We then programmed the ESP8266 microcontroller that is the brain of the sensor rig to send its telemetry data to Azure IoT Hub. We configured Azure IoT Hub to store off our data for future use. We then setup a Power BI instance and configured Azure Stream Analytics to pull live data from the Azure IoT Hub and send it to Power BI. After that we used Power BI Desktop to chart our data in a couple of different ways and then publish the reports up to Power BI so we can see them from anywhere we have an Internet connection.
In the next and (hopefully) final post of this series we will look at the data and determine "Why is my office so hot?".
Blog Series Table of Contents
Part 1 - Problem Space
Part 2 - Electronics
Part 3 - ESP8266 Code
Part 4 - Azure IoT Hub
Part 5 - Azure Stream Analytics
Part 6 - Power BI <-- This post
Part 7 - Drawing Conclusions


Comments