
Photo by Easton Oliver / Unsplash
The story so far...
In the first part of this series I described the problem I was having, my hypothesis as to the source of the issue, and the steps I would take to test my hypothesis. In the second post I described the electronics that I built to start capturing environmental sensor data. The third post describes the code for the IoT sensor rig to send telemetry data to Azure IoT Hub. The fourth post addressed the configuration within Azure IoT Hub. The fifth post got Power BI and Azure Stream Analytics configured to pass data from Azure IoT Hub to Power BI. The sixth post showed how to get the data charted in Power BI.
This post will close out the series. We will analyze the data in Power BI and draw our conclusion from it.
Blog Series Table of Contents
Part 1 - Problem Space
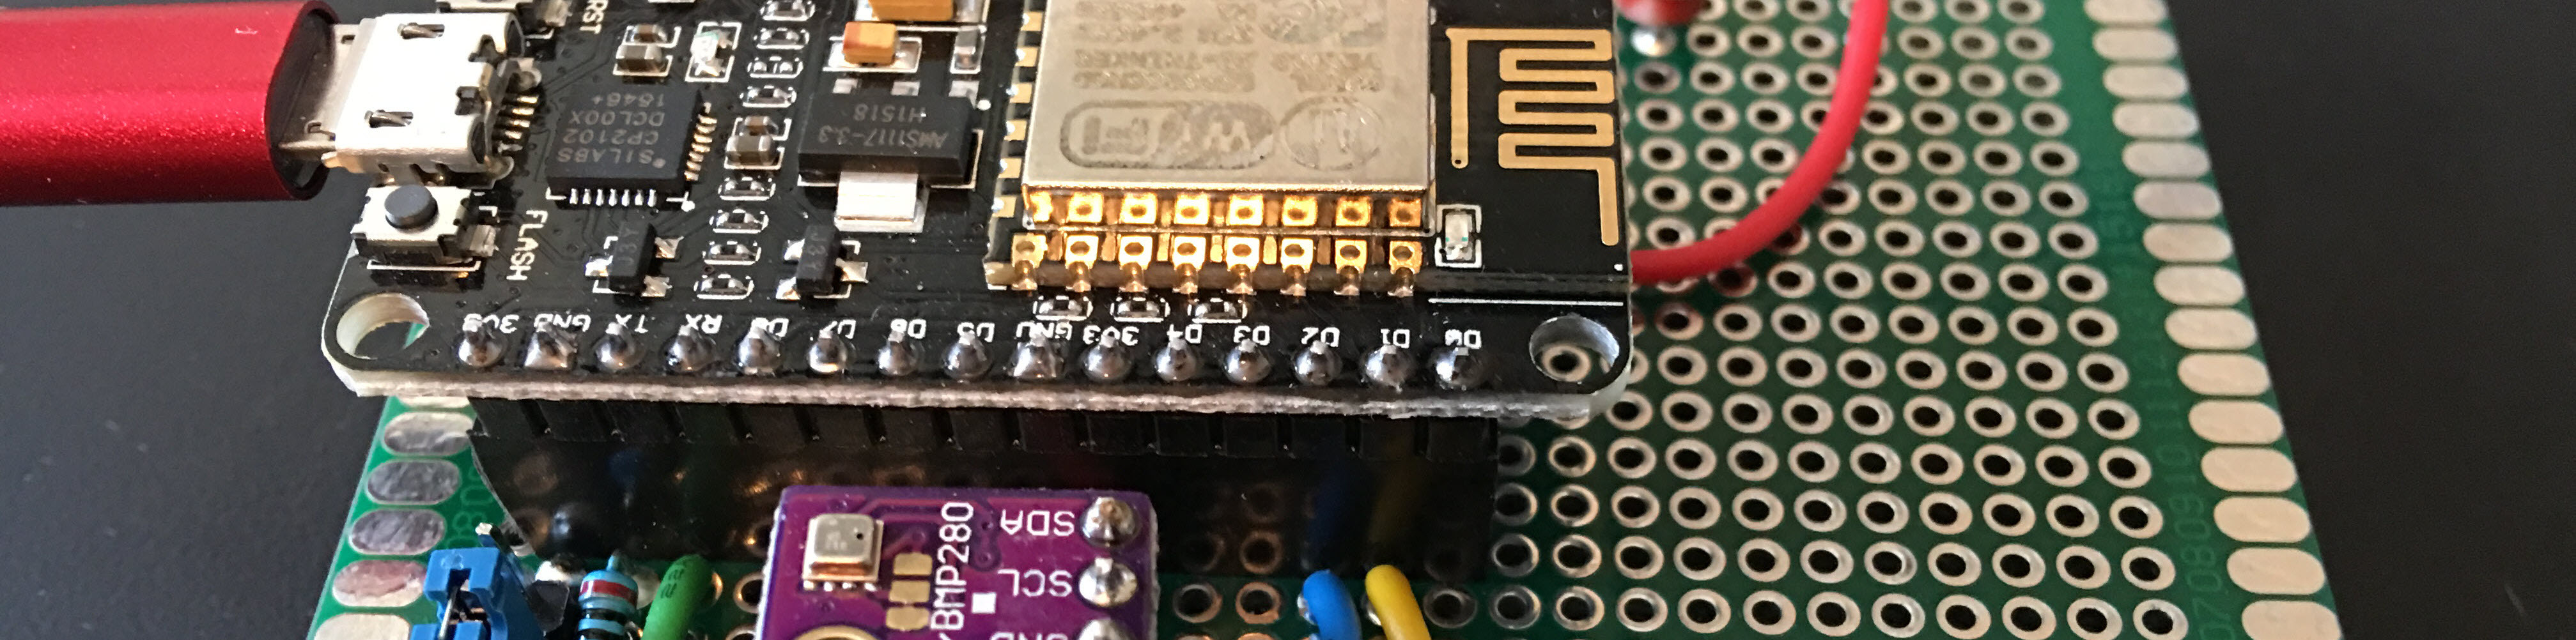
Part 2 - Electronics
Part 3 - ESP8266 Code
Part 4 - Azure IoT Hub
Part 5 - Azure Stream Analytics
Part 6 - Power BI
Part 7 - Drawing Conclusions <-- This post
Reviewing the collected data
Way back in Part 1 (and in the series title) I said that Azure IoT helped me buy a new house. Notice the word "helped"...it's in the past tense. This experiment was initially conducted in May and June of 2016 at my old house. To write this blog, I have reproduced all of the original elements, but the data is from my new house. This gives us the opportunity to compare data from both houses.
When comparing the two datasets, please note that the new house data was taken at 15 minute intervals whereas the old house data was taken at
The new house data
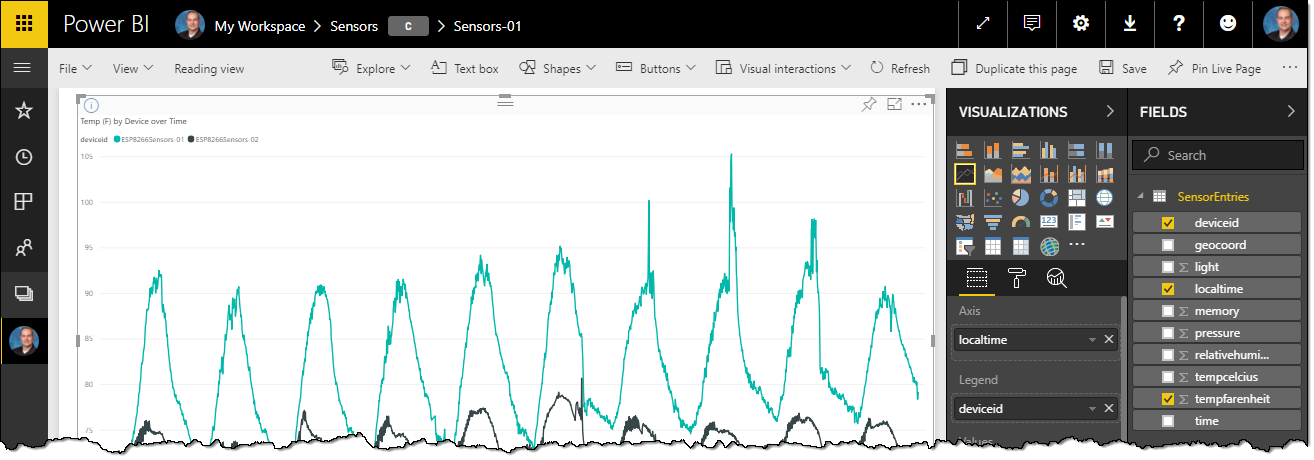
The temperature(°F) data that I collected from the new house looks like this.
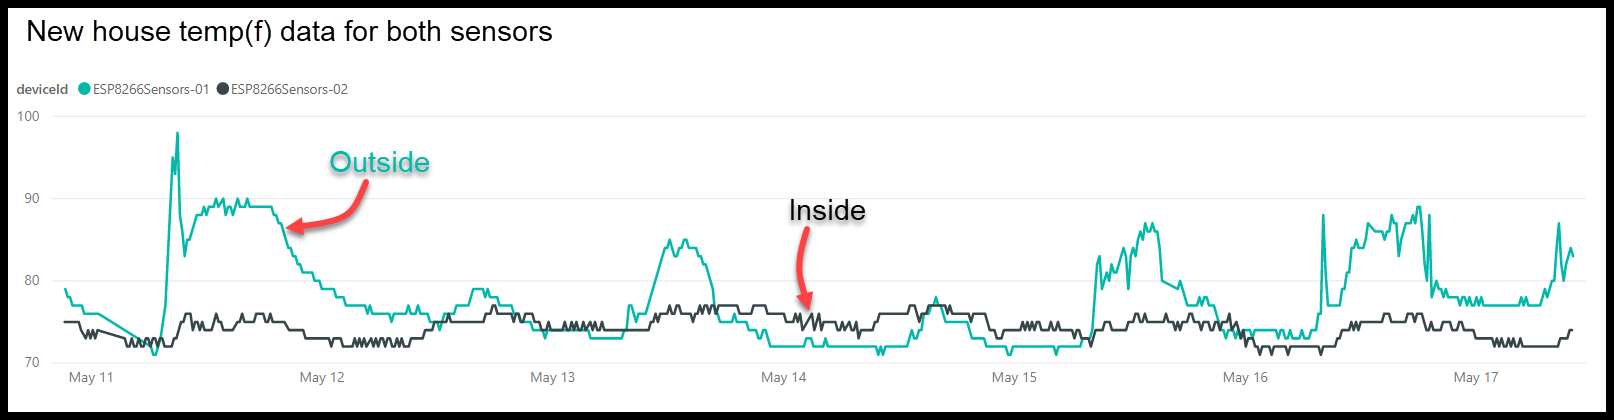
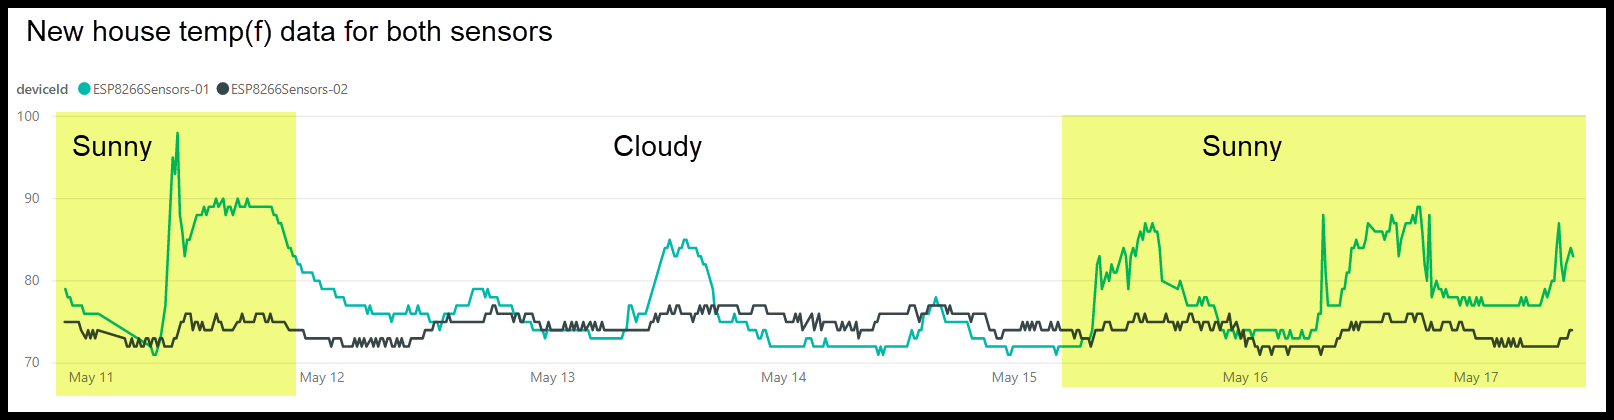
Reviewing this temperature data we can see that the inside temperature (ESP8266Sensors-02) bounces between 71°F and 77°F regardless of the outside temperatures. During this period we had a number of days that were overcast and rainy as you can see by the outside temps on May 12th, 13th, and 15th, which kept outside temperatures below 80°F. The flow of the inside temperature remained relatively stable during this period and when we had full sunny days.
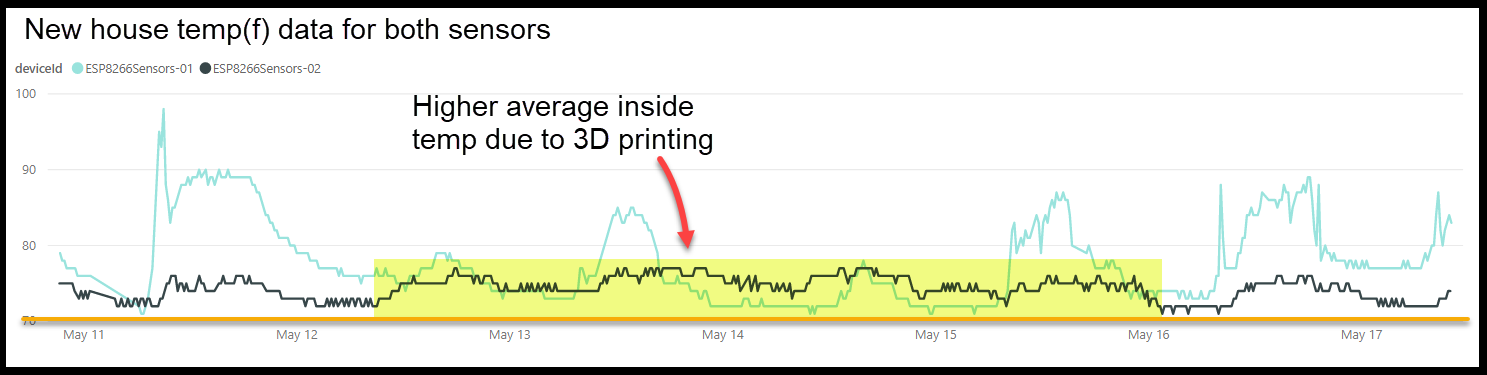
Looking more closely at the data you can see that the high and low temperatures inside my office were a few degrees higher between May 12th and 16th. This increase in average temperature was due to my running a pair of 3D printers in my office over those days. The heated bed of each printer was running at 60°C (140°F) or 80°C (176°F) which increased the room's ambient temp. It's cool that the impact of the printers shows up in the data.
So the new house's insulation and a/c system can provide a very consistent level of comfort to my office regardless of the outside temperatures.
The old house data
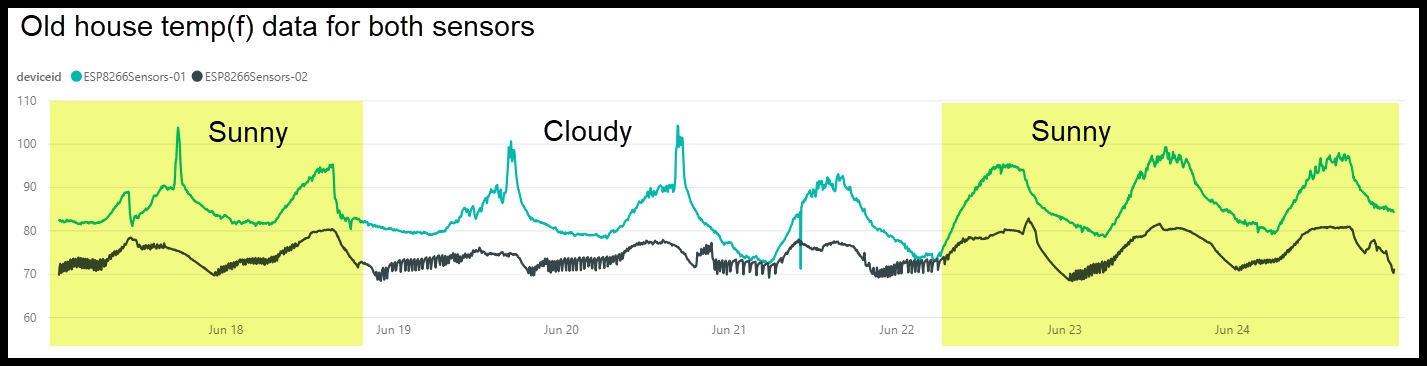
A subset of the temperature(°F) data I collected from the old house is below. There is a lot more, but this data is indicative of the problems I was researching.
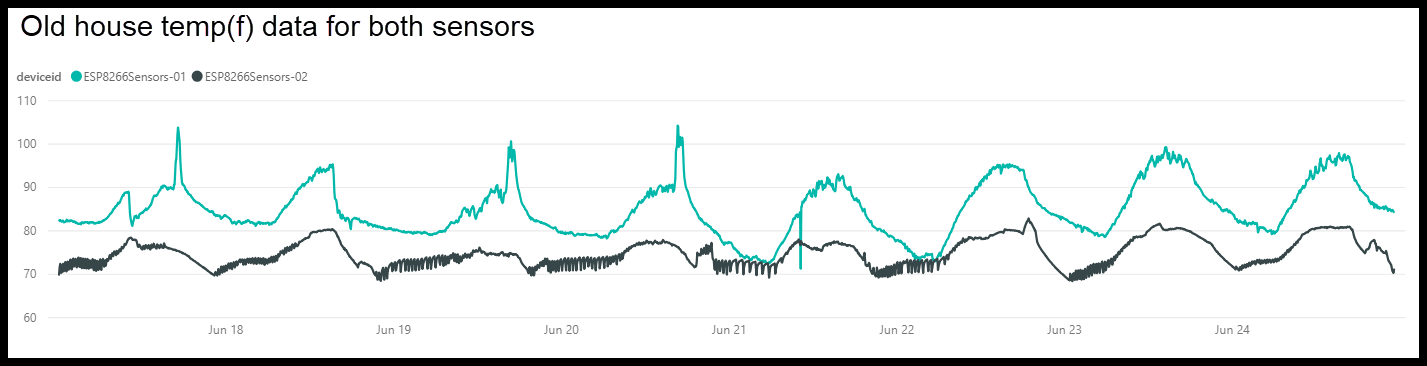
Looking at this data I can clearly see the sunny days (June 17th, 18th, 22nd, 23rd, 24th) and the cloudy days (June 19th, 20th and 21st). You can see this by looking at how the indoor temp and the outdoor temp rise and fall over time. On the sunny days, the indoor temp follows the rise and fall of the outdoor temp. On the cloudy days we don't see as much correlation.
Conclusions
Given this data, it is plainly obvious that I am no data scientist and my methods are sloppy, but I have come to the conclusion that the only way to get the old house's temperature to be agnostic to the outside temperate would be to add additional insulation to the attic, upgrade the windows to double-pane glass, and possibly replace the condenser with a larger unit. Since it wasn't not my house (remember, it's a rental) I was not about to spend money to have that done. Instead we purchased a new house that is energy efficient, and I have the (bogus, non-scientific) data to prove it.
Wrap up
If you've come this far, I want to thank you for taking your time to travel through this little project with me. Hopefully I've shown that it's pretty easy to tie microcontrollers, Azure IoT SDK for C, Azure IoT Hub, Azure Stream Analytics and Power BI together to gather interesting data and present it in a meaningful way.
Blog Series Table of Contents
Part 1 - Problem Space
Part 2 - Electronics
Part 3 - ESP8266 Code
Part 4 - Azure IoT Hub
Part 5 - Azure Stream Analytics
Part 6 - Power BI
Part 7 - Drawing Conclusions <-- This post


Comments